|
Download Data (XLS File) |
|
||||||||
|
||||||||
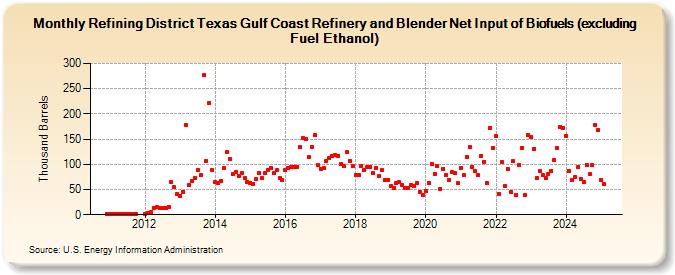
| Refining District Texas Gulf Coast Refinery and Blender Net Input of Biofuels (excluding Fuel Ethanol) (Thousand Barrels) | ||||||||
| Year | Jan | Feb | Mar | Apr | May | Jun | Jul | Aug | Sep | Oct | Nov | Dec |
|---|---|---|---|---|---|---|---|---|---|---|---|---|
| 2010 | 1 | |||||||||||
| 2011 | 1 | 1 | 1 | 1 | 1 | 2 | 1 | 2 | 2 | 1 | ||
| 2012 | 1 | 4 | 5 | 14 | 15 | 14 | 13 | 14 | 16 | 64 | 54 | 42 |
| 2013 | 37 | 46 | 178 | 58 | 67 | 73 | 89 | 78 | 277 | 107 | 222 | 88 |
| 2014 | 64 | 62 | 67 | 93 | 124 | 111 | 80 | 84 | 77 | 82 | 72 | 65 |
| 2015 | 63 | 61 | 71 | 83 | 72 | 82 | 89 | 93 | 82 | 88 | 73 | 69 |
| 2016 | 88 | 92 | 94 | 95 | 95 | 135 | 152 | 150 | 114 | 135 | 158 | 98 |
| 2017 | 91 | 93 | 106 | 113 | 117 | 118 | 117 | 101 | 96 | 124 | 107 | 97 |
| 2018 | 79 | 78 | 97 | 88 | 95 | 94 | 82 | 93 | 77 | 89 | 69 | 69 |
| 2019 | 57 | 53 | 63 | 64 | 59 | 53 | 53 | 59 | 56 | 62 | 46 | 39 |
| 2020 | 48 | 62 | 101 | 80 | 96 | 52 | 91 | 78 | 69 | 84 | 82 | 62 |
| 2021 | 93 | 78 | 115 | 135 | 95 | 86 | 78 | 117 | 105 | 62 | 173 | 133 |
| 2022 | 156 | 42 | 105 | 57 | 91 | 45 | 106 | 40 | 99 | 133 | 39 | 159 |
| 2023 | 144 | 120 | 114 | 78 | 64 | 63 | 80 | 58 | 100 | 119 | 163 | 167 |
| 2024 | 157 | |||||||||||
| - = No Data Reported; -- = Not Applicable; NA = Not Available; W = Withheld to avoid disclosure of individual company data. |
| Release Date: 3/29/2024 |
| Next Release Date: 4/30/2024 |