|
Download Data (XLS File) |
|
||||||||
|
||||||||
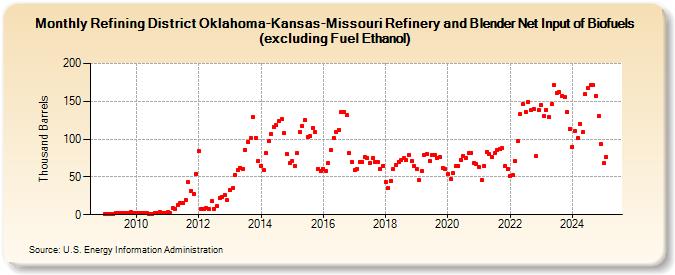
| Refining District Oklahoma-Kansas-Missouri Refinery and Blender Net Input of Biofuels (excluding Fuel Ethanol) (Thousand Barrels) | ||||||||
| Year | Jan | Feb | Mar | Apr | May | Jun | Jul | Aug | Sep | Oct | Nov | Dec |
|---|---|---|---|---|---|---|---|---|---|---|---|---|
| 2009 | 1 | 1 | 1 | 1 | 2 | 2 | 2 | 2 | 2 | 2 | 3 | 2 |
| 2010 | 2 | 2 | 2 | 2 | 2 | 1 | 1 | 2 | 2 | 3 | 2 | 2 |
| 2011 | 3 | 2 | 9 | 8 | 13 | 16 | 15 | 20 | 43 | 32 | 28 | 54 |
| 2012 | 84 | 8 | 7 | 9 | 7 | 18 | 8 | 11 | 22 | 24 | 26 | 19 |
| 2013 | 33 | 35 | 53 | 59 | 62 | 61 | 86 | 96 | 101 | 129 | 102 | 71 |
| 2014 | 65 | 59 | 81 | 97 | 107 | 116 | 118 | 124 | 126 | 108 | 80 | 68 |
| 2015 | 71 | 65 | 81 | 109 | 117 | 125 | 103 | 104 | 115 | 109 | 61 | 58 |
| 2016 | 61 | 58 | 68 | 85 | 102 | 110 | 112 | 136 | 136 | 132 | 81 | 70 |
| 2017 | 59 | 61 | 70 | 70 | 76 | 75 | 69 | 75 | 70 | 70 | 61 | 65 |
| 2018 | 43 | 35 | 45 | 60 | 66 | 70 | 72 | 75 | 72 | 79 | 71 | 64 |
| 2019 | 60 | 46 | 58 | 79 | 80 | 71 | 79 | 79 | 75 | 76 | 62 | 60 |
| 2020 | 54 | 47 | 55 | 64 | 65 | 73 | 78 | 75 | 82 | 82 | 69 | 67 |
| 2021 | 63 | 46 | 65 | 83 | 80 | 76 | 81 | 86 | 87 | 88 | 64 | 60 |
| 2022 | 51 | 52 | 71 | 97 | 133 | 146 | 136 | 149 | 138 | 140 | 77 | 138 |
| 2023 | 145 | 130 | 140 | 129 | 146 | 171 | 161 | 162 | 157 | 156 | 136 | 114 |
| 2024 | 90 | |||||||||||
| - = No Data Reported; -- = Not Applicable; NA = Not Available; W = Withheld to avoid disclosure of individual company data. |
| Release Date: 3/29/2024 |
| Next Release Date: 4/30/2024 |