|
Download Data (XLS File) |
|
||||||||
|
||||||||
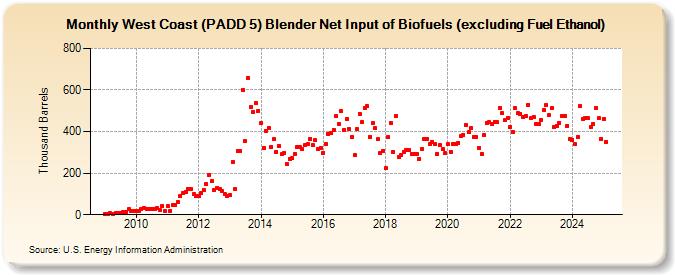
| West Coast (PADD 5) Blender Net Input of Biofuels (excluding Fuel Ethanol) (Thousand Barrels) | ||||||||
| Year | Jan | Feb | Mar | Apr | May | Jun | Jul | Aug | Sep | Oct | Nov | Dec |
|---|---|---|---|---|---|---|---|---|---|---|---|---|
| 2009 | 4 | 4 | 7 | 5 | 7 | 7 | 7 | 13 | 13 | 26 | 20 | 19 |
| 2010 | 20 | 17 | 28 | 34 | 26 | 26 | 27 | 29 | 32 | 21 | 43 | 16 |
| 2011 | 40 | 20 | 46 | 46 | 61 | 89 | 104 | 111 | 125 | 126 | 99 | 90 |
| 2012 | 91 | 104 | 121 | 149 | 193 | 162 | 119 | 130 | 122 | 113 | 100 | 91 |
| 2013 | 96 | 254 | 122 | 307 | 305 | 602 | 354 | 658 | 520 | 496 | 536 | 501 |
| 2014 | 439 | 323 | 404 | 418 | 327 | 364 | 303 | 332 | 290 | 297 | 243 | 268 |
| 2015 | 271 | 293 | 324 | 324 | 316 | 333 | 340 | 366 | 335 | 358 | 314 | 323 |
| 2016 | 299 | 340 | 387 | 394 | 409 | 473 | 437 | 497 | 409 | 461 | 411 | 376 |
| 2017 | 287 | 410 | 486 | 447 | 515 | 521 | 374 | 440 | 417 | 362 | 298 | 306 |
| 2018 | 223 | 373 | 442 | 303 | 473 | 278 | 285 | 304 | 310 | 312 | 294 | 290 |
| 2019 | 291 | 270 | 317 | 364 | 366 | 338 | 352 | 340 | 294 | 335 | 315 | 297 |
| 2020 | 340 | 304 | 342 | 341 | 347 | 377 | 385 | 432 | 396 | 416 | 376 | 374 |
| 2021 | 323 | 294 | 384 | 442 | 444 | 435 | 446 | 444 | 513 | 488 | 454 | 464 |
| 2022 | 424 | 398 | 514 | 487 | 486 | 470 | 474 | 529 | 466 | 471 | 438 | 438 |
| 2023 | 457 | 486 | 529 | 479 | 517 | 423 | 428 | 443 | 476 | 475 | 428 | 364 |
| 2024 | 360 | |||||||||||
| - = No Data Reported; -- = Not Applicable; NA = Not Available; W = Withheld to avoid disclosure of individual company data. |
| Release Date: 3/29/2024 |
| Next Release Date: 4/30/2024 |