|
Download Data (XLS File) |
|
||||||||
|
||||||||
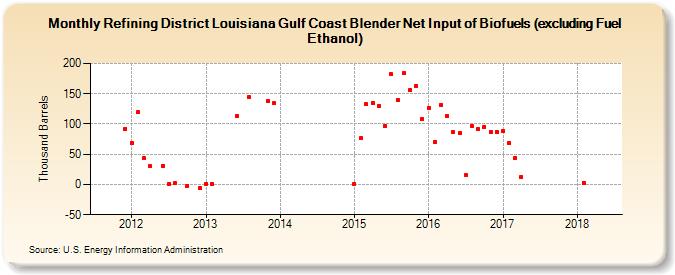
| Refining District Louisiana Gulf Coast Blender Net Input of Biofuels (excluding Fuel Ethanol) (Thousand Barrels) | ||||||||
| Year | Jan | Feb | Mar | Apr | May | Jun | Jul | Aug | Sep | Oct | Nov | Dec |
|---|---|---|---|---|---|---|---|---|---|---|---|---|
| 2011 | 92 | |||||||||||
| 2012 | 69 | 119 | 43 | 30 | 31 | 1 | 2 | -2 | -6 | |||
| 2013 | 1 | 1 | 113 | 144 | 138 | 134 | ||||||
| 2015 | 1 | 76 | 133 | 135 | 130 | 96 | 182 | 140 | 184 | 156 | 163 | 108 |
| 2016 | 127 | 70 | 132 | 113 | 86 | 85 | 15 | 97 | 92 | 95 | 87 | 87 |
| 2017 | 88 | 69 | 44 | 12 | ||||||||
| 2018 | 3 |
| - = No Data Reported; -- = Not Applicable; NA = Not Available; W = Withheld to avoid disclosure of individual company data. |
| Release Date: 6/28/2024 |
| Next Release Date: 7/31/2024 |