|
Download Data (XLS File) |
|
||||||||
|
||||||||
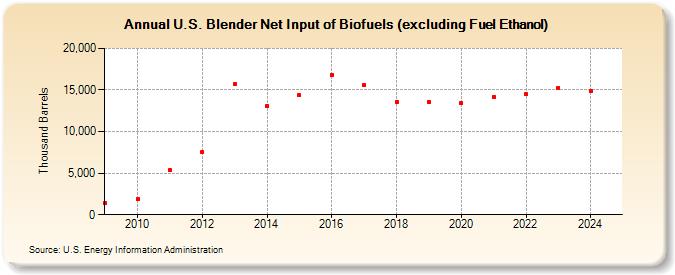
| U.S. Blender Net Input of Biofuels (excluding Fuel Ethanol) (Thousand Barrels) | ||||||||
| Decade | Year-0 | Year-1 | Year-2 | Year-3 | Year-4 | Year-5 | Year-6 | Year-7 | Year-8 | Year-9 |
|---|---|---|---|---|---|---|---|---|---|---|
| 2000's | 1,370 | |||||||||
| 2010's | 1,867 | 5,330 | 7,571 | 15,663 | 13,079 | 14,425 | 16,815 | 15,580 | 13,562 | 13,500 |
| 2020's | 13,389 | 14,189 | 14,469 | 15,216 |
| - = No Data Reported; -- = Not Applicable; NA = Not Available; W = Withheld to avoid disclosure of individual company data. |
| Release Date: 3/29/2024 |
| Next Release Date: 8/30/2024 |
Referring Pages: