|
Download Data (XLS File) |
|
||||||||
|
||||||||
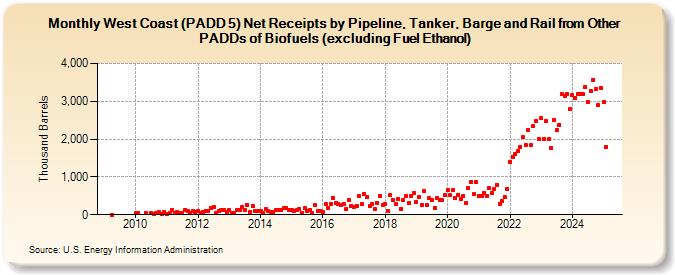
| West Coast (PADD 5) Net Receipts by Pipeline, Tanker, Barge and Rail from Other PADDs of Biofuels (excluding Fuel Ethanol) (Thousand Barrels) | ||||||||
| Year | Jan | Feb | Mar | Apr | May | Jun | Jul | Aug | Sep | Oct | Nov | Dec |
|---|---|---|---|---|---|---|---|---|---|---|---|---|
| 2009 | 4 | |||||||||||
| 2010 | 38 | 38 | 45 | 46 | 23 | 46 | 59 | 19 | 79 | |||
| 2011 | 23 | 46 | 132 | 55 | 80 | 38 | 44 | 135 | 87 | 43 | 91 | 64 |
| 2012 | 90 | 41 | 69 | 96 | 96 | 176 | 208 | 46 | 93 | 124 | 126 | 63 |
| 2013 | 128 | 55 | 36 | 116 | 137 | 206 | 130 | 259 | 81 | 227 | 103 | 86 |
| 2014 | 89 | 35 | 156 | 94 | 81 | 80 | 136 | 123 | 130 | 173 | 179 | 124 |
| 2015 | 128 | 108 | 114 | 145 | 56 | 168 | 110 | 133 | 51 | 254 | 108 | 105 |
| 2016 | 84 | 282 | 187 | 289 | 445 | 318 | 291 | 254 | 284 | 138 | 399 | 232 |
| 2017 | 202 | 241 | 488 | 296 | 561 | 479 | 229 | 277 | 159 | 313 | 487 | 257 |
| 2018 | 285 | 95 | 526 | 390 | 275 | 424 | 156 | 384 | 493 | 311 | 498 | 582 |
| 2019 | 346 | 476 | 249 | 620 | 251 | 435 | 378 | 174 | 443 | 385 | 381 | 509 |
| 2020 | 643 | 513 | 659 | 436 | 515 | 424 | 498 | 311 | 712 | 878 | 535 | 860 |
| 2021 | 489 | 492 | 573 | 485 | 711 | 580 | 684 | 798 | 278 | 367 | 465 | 690 |
| 2022 | 1,402 | 1,528 | 1,615 | 1,678 | 1,802 | 2,044 | 1,836 | 2,246 | 1,837 | 2,355 | 2,480 | 2,001 |
| 2023 | 2,546 | 1,993 | 2,466 | 1,999 | 1,756 | 2,517 | 2,251 | 2,383 | 2,496 | 3,209 | 3,229 | 2,787 |
| 2024 | 3,154 | 3,083 | 3,168 | 3,099 | ||||||||
| - = No Data Reported; -- = Not Applicable; NA = Not Available; W = Withheld to avoid disclosure of individual company data. |
| Release Date: 6/28/2024 |
| Next Release Date: 7/31/2024 |