|
Download Data (XLS File) |
|
||||||||
|
||||||||
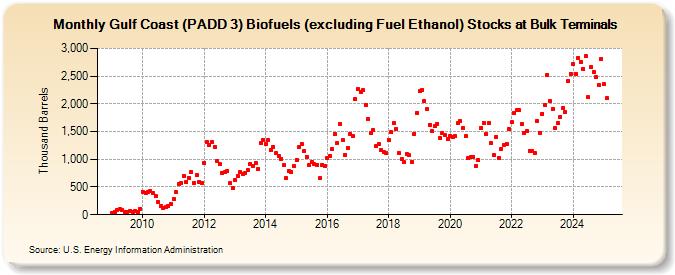
| Gulf Coast (PADD 3) Biofuels (excluding Fuel Ethanol) Stocks at Bulk Terminals (Thousand Barrels) | ||||||||
| Year | Jan | Feb | Mar | Apr | May | Jun | Jul | Aug | Sep | Oct | Nov | Dec |
|---|---|---|---|---|---|---|---|---|---|---|---|---|
| 2009 | 34 | 51 | 90 | 96 | 83 | 56 | 46 | 65 | 40 | 64 | 46 | 110 |
| 2010 | 413 | 397 | 416 | 424 | 391 | 330 | 231 | 157 | 122 | 138 | 155 | 200 |
| 2011 | 286 | 402 | 548 | 572 | 698 | 595 | 667 | 772 | 576 | 715 | 597 | 577 |
| 2012 | 938 | 1,305 | 1,257 | 1,308 | 1,227 | 963 | 911 | 746 | 770 | 797 | 565 | 482 |
| 2013 | 620 | 694 | 768 | 741 | 751 | 807 | 921 | 884 | 940 | 823 | 1,293 | 1,356 |
| 2014 | 1,275 | 1,346 | 1,165 | 1,222 | 1,107 | 1,058 | 1,013 | 900 | 657 | 784 | 766 | 876 |
| 2015 | 990 | 1,223 | 1,283 | 1,145 | 1,048 | 895 | 948 | 906 | 900 | 655 | 902 | 886 |
| 2016 | 1,028 | 1,064 | 1,188 | 1,464 | 1,290 | 1,631 | 1,350 | 1,085 | 1,205 | 1,458 | 1,419 | 2,087 |
| 2017 | 2,265 | 2,218 | 2,242 | 1,982 | 1,723 | 1,467 | 1,522 | 1,232 | 1,275 | 1,164 | 1,123 | 1,115 |
| 2018 | 1,351 | 1,486 | 1,651 | 1,548 | 1,116 | 1,003 | 946 | 1,100 | 1,069 | 959 | 1,463 | 1,841 |
| 2019 | 2,224 | 2,258 | 2,047 | 1,898 | 1,625 | 1,502 | 1,595 | 1,642 | 1,385 | 1,473 | 1,433 | 1,368 |
| 2020 | 1,418 | 1,401 | 1,414 | 1,649 | 1,686 | 1,571 | 1,414 | 1,019 | 1,039 | 1,048 | 880 | 985 |
| 2021 | 1,569 | 1,663 | 1,455 | 1,649 | 1,296 | 1,076 | 1,403 | 1,020 | 1,185 | 1,259 | 1,281 | 1,541 |
| 2022 | 1,667 | 1,833 | 1,881 | 1,880 | 1,633 | 1,479 | 1,503 | 1,153 | 1,149 | 1,115 | 1,693 | 1,480 |
| 2023 | 1,789 | 1,984 | 2,509 | 2,032 | 1,877 | 1,530 | 1,644 | 1,766 | 1,920 | 1,859 | 2,429 | 2,556 |
| 2024 | 2,712 | 2,545 | 2,827 | 2,761 | ||||||||
| - = No Data Reported; -- = Not Applicable; NA = Not Available; W = Withheld to avoid disclosure of individual company data. |
| Release Date: 6/28/2024 |
| Next Release Date: 7/31/2024 |