|
Download Data (XLS File) |
|
||||||||
|
||||||||
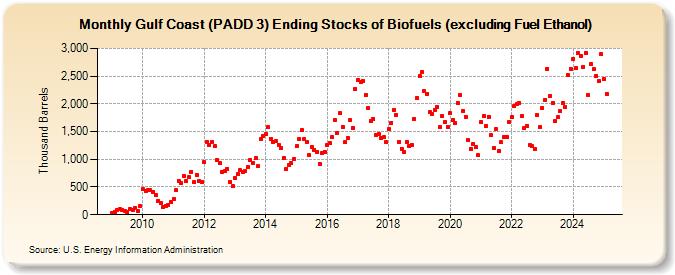
| Gulf Coast (PADD 3) Ending Stocks of Biofuels (excluding Fuel Ethanol) (Thousand Barrels) | ||||||||
| Year | Jan | Feb | Mar | Apr | May | Jun | Jul | Aug | Sep | Oct | Nov | Dec |
|---|---|---|---|---|---|---|---|---|---|---|---|---|
| 2009 | 34 | 51 | 90 | 96 | 83 | 72 | 54 | 101 | 88 | 123 | 62 | 152 |
| 2010 | 458 | 427 | 438 | 438 | 417 | 364 | 256 | 209 | 143 | 163 | 184 | 226 |
| 2011 | 286 | 440 | 614 | 572 | 698 | 600 | 673 | 778 | 584 | 721 | 605 | 585 |
| 2012 | 945 | 1,312 | 1,265 | 1,312 | 1,234 | 983 | 930 | 762 | 791 | 831 | 593 | 510 |
| 2013 | 668 | 726 | 801 | 774 | 782 | 858 | 986 | 935 | 1,014 | 874 | 1,359 | 1,427 |
| 2014 | 1,448 | 1,574 | 1,373 | 1,318 | 1,322 | 1,265 | 1,199 | 1,017 | 827 | 895 | 929 | 1,004 |
| 2015 | 1,237 | 1,374 | 1,535 | 1,360 | 1,303 | 1,070 | 1,218 | 1,175 | 1,139 | 918 | 1,113 | 1,139 |
| 2016 | 1,257 | 1,290 | 1,399 | 1,710 | 1,479 | 1,827 | 1,589 | 1,304 | 1,390 | 1,705 | 1,573 | 2,274 |
| 2017 | 2,435 | 2,398 | 2,411 | 2,164 | 1,920 | 1,687 | 1,732 | 1,443 | 1,455 | 1,388 | 1,396 | 1,304 |
| 2018 | 1,541 | 1,661 | 1,892 | 1,806 | 1,316 | 1,191 | 1,136 | 1,319 | 1,235 | 1,265 | 1,726 | 2,109 |
| 2019 | 2,503 | 2,575 | 2,223 | 2,184 | 1,850 | 1,822 | 1,897 | 1,945 | 1,577 | 1,787 | 1,674 | 1,589 |
| 2020 | 1,830 | 1,700 | 1,650 | 2,023 | 2,162 | 1,875 | 1,768 | 1,340 | 1,192 | 1,279 | 1,214 | 1,072 |
| 2021 | 1,664 | 1,783 | 1,602 | 1,768 | 1,429 | 1,201 | 1,540 | 1,154 | 1,306 | 1,396 | 1,406 | 1,667 |
| 2022 | 1,760 | 1,959 | 1,992 | 2,018 | 1,773 | 1,565 | 1,606 | 1,257 | 1,231 | 1,194 | 1,795 | 1,575 |
| 2023 | 1,893 | 2,079 | 2,619 | 2,132 | 1,989 | 1,655 | 1,753 | 1,865 | 2,014 | 1,956 | 2,533 | 2,645 |
| 2024 | 2,809 | 2,640 | 2,914 | 2,867 | ||||||||
| - = No Data Reported; -- = Not Applicable; NA = Not Available; W = Withheld to avoid disclosure of individual company data. |
| Release Date: 6/28/2024 |
| Next Release Date: 7/31/2024 |