|
Download Data (XLS File) |
|
||||||||
|
||||||||
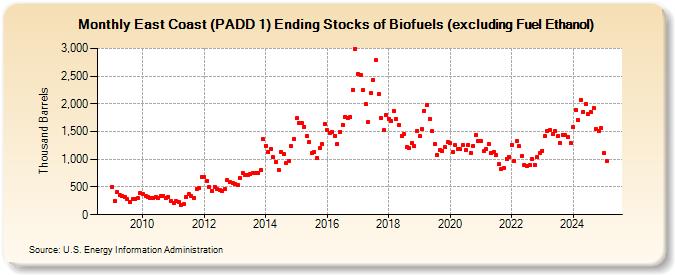
| East Coast (PADD 1) Ending Stocks of Biofuels (excluding Fuel Ethanol) (Thousand Barrels) | ||||||||
| Year | Jan | Feb | Mar | Apr | May | Jun | Jul | Aug | Sep | Oct | Nov | Dec |
|---|---|---|---|---|---|---|---|---|---|---|---|---|
| 2009 | 504 | 241 | 409 | 352 | 340 | 325 | 276 | 237 | 277 | 285 | 293 | 393 |
| 2010 | 365 | 342 | 315 | 300 | 308 | 319 | 302 | 342 | 344 | 293 | 319 | 256 |
| 2011 | 207 | 243 | 230 | 181 | 186 | 313 | 366 | 340 | 306 | 466 | 479 | 682 |
| 2012 | 678 | 605 | 491 | 429 | 496 | 458 | 441 | 422 | 468 | 629 | 591 | 573 |
| 2013 | 554 | 533 | 667 | 761 | 712 | 716 | 738 | 759 | 746 | 760 | 810 | 1,359 |
| 2014 | 1,246 | 1,130 | 1,192 | 1,036 | 958 | 807 | 1,128 | 1,098 | 928 | 975 | 1,239 | 1,369 |
| 2015 | 1,739 | 1,657 | 1,651 | 1,591 | 1,417 | 1,320 | 1,111 | 1,135 | 1,019 | 1,201 | 1,270 | 1,640 |
| 2016 | 1,519 | 1,479 | 1,491 | 1,422 | 1,279 | 1,493 | 1,621 | 1,764 | 1,749 | 1,766 | 2,254 | 2,994 |
| 2017 | 2,536 | 2,512 | 2,242 | 1,991 | 1,674 | 2,192 | 2,432 | 2,785 | 2,171 | 1,738 | 1,523 | 1,795 |
| 2018 | 1,732 | 1,685 | 1,871 | 1,728 | 1,612 | 1,422 | 1,449 | 1,218 | 1,195 | 1,291 | 1,235 | 1,513 |
| 2019 | 1,415 | 1,544 | 1,878 | 1,986 | 1,732 | 1,505 | 1,267 | 1,078 | 1,163 | 1,145 | 1,216 | 1,305 |
| 2020 | 1,290 | 1,137 | 1,250 | 1,177 | 1,185 | 1,251 | 1,159 | 1,261 | 1,119 | 1,246 | 1,437 | 1,332 |
| 2021 | 1,325 | 1,142 | 1,182 | 1,273 | 1,119 | 1,138 | 1,074 | 910 | 832 | 839 | 1,011 | 1,047 |
| 2022 | 1,265 | 966 | 1,326 | 1,234 | 1,061 | 902 | 885 | 892 | 1,013 | 902 | 1,040 | 1,106 |
| 2023 | 1,146 | 1,414 | 1,515 | 1,524 | 1,449 | 1,514 | 1,415 | 1,270 | 1,423 | 1,432 | 1,400 | 1,290 |
| 2024 | 1,580 | 1,896 | 1,717 | 2,075 | ||||||||
| - = No Data Reported; -- = Not Applicable; NA = Not Available; W = Withheld to avoid disclosure of individual company data. |
| Release Date: 6/28/2024 |
| Next Release Date: 7/31/2024 |