|
Download Data (XLS File) |
|
||||||||
|
||||||||
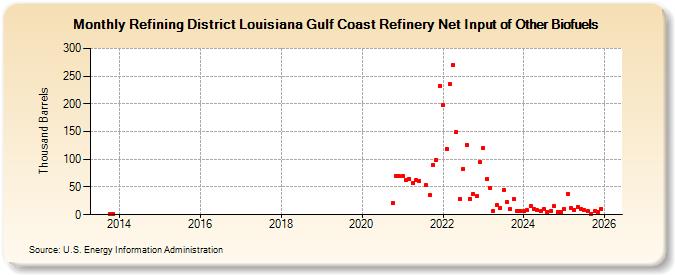
| Refining District Louisiana Gulf Coast Refinery Net Input of Other Biofuels (Thousand Barrels) | ||||||||
| Year | Jan | Feb | Mar | Apr | May | Jun | Jul | Aug | Sep | Oct | Nov | Dec |
|---|---|---|---|---|---|---|---|---|---|---|---|---|
| 2013 | 1 | 1 | ||||||||||
| 2020 | 21 | 70 | 69 | |||||||||
| 2021 | 70 | 63 | 65 | 58 | 62 | 61 | 53 | 36 | 90 | 99 | 233 | |
| 2022 | 197 | 119 | 235 | 270 | 149 | 28 | 83 | 126 | 29 | 37 | 33 | 95 |
| 2023 | 121 | 65 | 49 | 7 | 17 | 13 | 45 | 23 | 10 | 28 | 7 | 6 |
| 2024 | 6 | |||||||||||
| - = No Data Reported; -- = Not Applicable; NA = Not Available; W = Withheld to avoid disclosure of individual company data. |
| Release Date: 3/29/2024 |
| Next Release Date: 4/30/2024 |