|
Download Data (XLS File) |
|
||||||||
|
||||||||
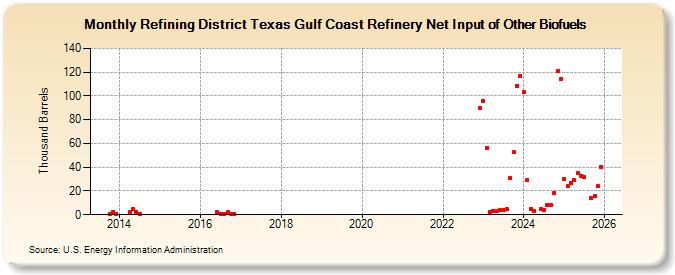
| Refining District Texas Gulf Coast Refinery Net Input of Other Biofuels (Thousand Barrels) | ||||||||
| Year | Jan | Feb | Mar | Apr | May | Jun | Jul | Aug | Sep | Oct | Nov | Dec |
|---|---|---|---|---|---|---|---|---|---|---|---|---|
| 2013 | 1 | 2 | 1 | |||||||||
| 2014 | 2 | 5 | 2 | 1 | ||||||||
| 2016 | 2 | 1 | 1 | 2 | 1 | 1 | ||||||
| 2022 | 90 | |||||||||||
| 2023 | 96 | 56 | 2 | 3 | 3 | 4 | 4 | 5 | 31 | 53 | 108 | 117 |
| 2024 | 103 | |||||||||||
| - = No Data Reported; -- = Not Applicable; NA = Not Available; W = Withheld to avoid disclosure of individual company data. |
| Release Date: 3/29/2024 |
| Next Release Date: 4/30/2024 |
Referring Pages: