|
Download Data (XLS File) |
|
|||||
|
|||||
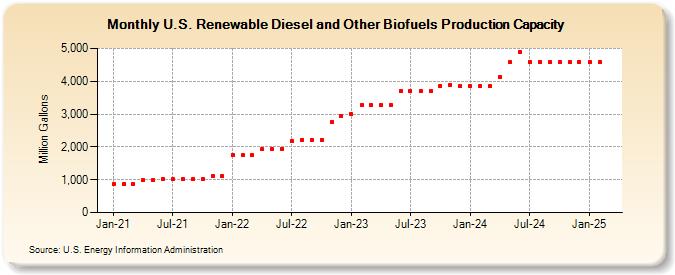
| U.S. Renewable Diesel and Other Biofuels Production Capacity (Million Gallons) | |||||
| Year | Jan | Feb | Mar | Apr | May | Jun | Jul | Aug | Sep | Oct | Nov | Dec |
|---|---|---|---|---|---|---|---|---|---|---|---|---|
| 2021 | 863 | 863 | 863 | 983 | 983 | 1,014 | 1,014 | 1,014 | 1,014 | 1,014 | 1,106 | 1,106 |
| 2022 | 1,750 | 1,750 | 1,750 | 1,922 | 1,947 | 1,947 | 2,174 | 2,219 | 2,219 | 2,219 | 2,755 | 2,939 |
| 2023 | 2,939 | 3,260 | 3,278 | 3,278 | 3,278 | 3,700 | 3,704 | 3,704 | 3,704 | 3,857 | 3,857 | 3,857 |
| 2024 | 3,857 | |||||||||||
| - = No Data Reported; -- = Not Applicable; NA = Not Available; W = Withheld to avoid disclosure of individual company data. |
| Release Date: 3/29/2024 |
| Next Release Date: 4/30/2024 |