|
Download Data (XLS File) |
|
||||||||
|
||||||||
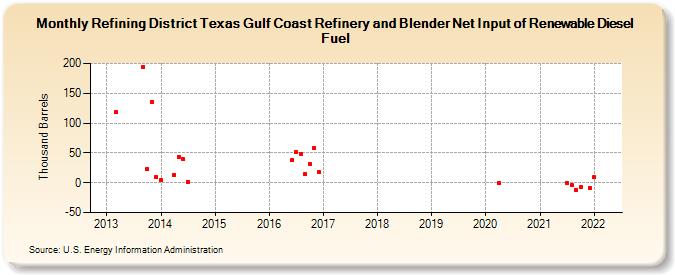
| Refining District Texas Gulf Coast Refinery and Blender Net Input of Renewable Diesel Fuel (Thousand Barrels) | ||||||||
| Year | Jan | Feb | Mar | Apr | May | Jun | Jul | Aug | Sep | Oct | Nov | Dec |
|---|---|---|---|---|---|---|---|---|---|---|---|---|
| 2013 | 118 | 194 | 23 | 136 | 10 | |||||||
| 2014 | 4 | 13 | 44 | 39 | 2 | |||||||
| 2016 | 38 | 51 | 49 | 14 | 31 | 58 | 18 | |||||
| 2020 | 0 | |||||||||||
| 2021 | -1 | -4 | -13 | -7 | -9 | |||||||
| 2022 | 9 | |||||||||||
| - = No Data Reported; -- = Not Applicable; NA = Not Available; W = Withheld to avoid disclosure of individual company data. |
| Release Date: 3/29/2024 |
| Next Release Date: 4/30/2024 |