|
Download Data (XLS File) |
|
||||||||
|
||||||||
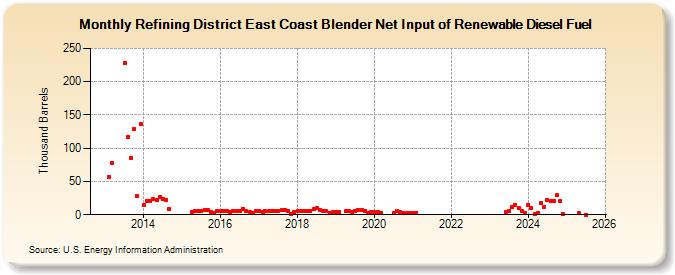
| Refining District East Coast Blender Net Input of Renewable Diesel Fuel (Thousand Barrels) | ||||||||
| Year | Jan | Feb | Mar | Apr | May | Jun | Jul | Aug | Sep | Oct | Nov | Dec |
|---|---|---|---|---|---|---|---|---|---|---|---|---|
| 2013 | 57 | 78 | 228 | 117 | 85 | 129 | 28 | 136 | ||||
| 2014 | 14 | 21 | 21 | 23 | 22 | 26 | 23 | 22 | 9 | |||
| 2015 | 4 | 5 | 5 | 6 | 7 | 7 | 4 | 2 | 5 | |||
| 2016 | 5 | 5 | 5 | 4 | 6 | 5 | 5 | 9 | 5 | 4 | 3 | 5 |
| 2017 | 5 | 4 | 5 | 5 | 5 | 5 | 5 | 7 | 7 | 5 | 1 | 4 |
| 2018 | 5 | 5 | 5 | 5 | 5 | 8 | 10 | 7 | 6 | 5 | 3 | 4 |
| 2019 | 4 | 4 | 5 | 5 | 4 | 6 | 7 | 7 | 5 | 2 | 4 | |
| 2020 | 4 | 4 | 3 | 2 | 6 | 4 | 3 | 2 | 2 | |||
| 2021 | 3 | 3 | ||||||||||
| 2023 | 4 | 5 | 11 | 15 | 10 | 6 | 3 | |||||
| 2024 | 15 | |||||||||||
| - = No Data Reported; -- = Not Applicable; NA = Not Available; W = Withheld to avoid disclosure of individual company data. |
| Release Date: 3/29/2024 |
| Next Release Date: 4/30/2024 |
Referring Pages: