|
Download Data (XLS File) |
|
||||||||
|
||||||||
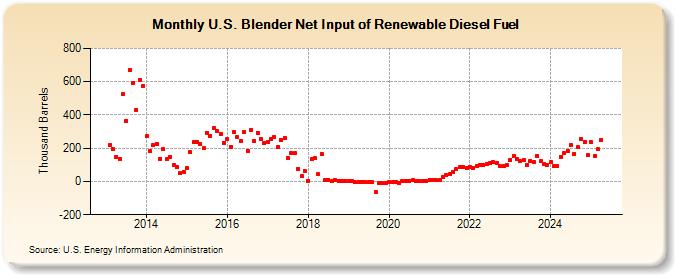
| U.S. Blender Net Input of Renewable Diesel Fuel (Thousand Barrels) | ||||||||
| Year | Jan | Feb | Mar | Apr | May | Jun | Jul | Aug | Sep | Oct | Nov | Dec |
|---|---|---|---|---|---|---|---|---|---|---|---|---|
| 2013 | 218 | 196 | 148 | 136 | 523 | 365 | 670 | 594 | 430 | 612 | 575 | |
| 2014 | 271 | 181 | 220 | 227 | 137 | 194 | 135 | 150 | 97 | 85 | 48 | 57 |
| 2015 | 78 | 175 | 238 | 240 | 223 | 202 | 293 | 275 | 320 | 304 | 288 | 233 |
| 2016 | 255 | 209 | 298 | 266 | 243 | 300 | 185 | 310 | 242 | 293 | 254 | 230 |
| 2017 | 238 | 256 | 266 | 209 | 248 | 263 | 141 | 170 | 169 | 77 | 33 | 64 |
| 2018 | 5 | 132 | 141 | 43 | 167 | 6 | 11 | 0 | 6 | 5 | 1 | 2 |
| 2019 | 1 | 1 | -5 | -1 | -1 | -5 | -3 | -2 | -63 | -7 | -10 | -7 |
| 2020 | -3 | -5 | -3 | -10 | 4 | 3 | 3 | 7 | 1 | 0 | 3 | 0 |
| 2021 | 10 | 8 | 7 | 7 | 29 | 37 | 42 | 57 | 73 | 85 | 89 | 81 |
| 2022 | 89 | 83 | 94 | 97 | 96 | 104 | 110 | 115 | 112 | 91 | 90 | 99 |
| 2023 | 130 | 153 | 137 | 124 | 131 | 102 | 124 | 115 | 151 | 121 | 104 | 99 |
| 2024 | 115 | |||||||||||
| - = No Data Reported; -- = Not Applicable; NA = Not Available; W = Withheld to avoid disclosure of individual company data. |
| Release Date: 3/29/2024 |
| Next Release Date: 4/30/2024 |
Referring Pages: