|
Download Data (XLS File) |
|
||||||||
|
||||||||
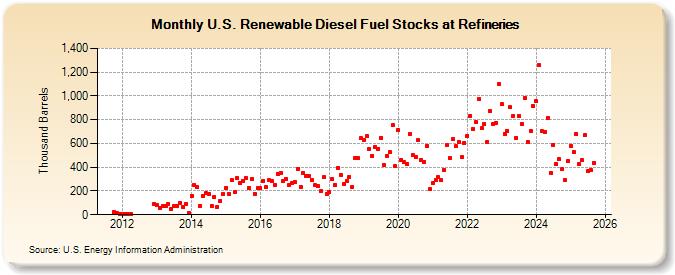
| U.S. Renewable Diesel Fuel Stocks at Refineries (Thousand Barrels) | ||||||||
| Year | Jan | Feb | Mar | Apr | May | Jun | Jul | Aug | Sep | Oct | Nov | Dec |
|---|---|---|---|---|---|---|---|---|---|---|---|---|
| 2011 | 27 | 11 | 7 | |||||||||
| 2012 | 7 | 7 | 7 | 10 | 94 | |||||||
| 2013 | 79 | 58 | 72 | 76 | 91 | 52 | 73 | 75 | 102 | 63 | 91 | 17 |
| 2014 | 160 | 250 | 232 | 76 | 160 | 179 | 173 | 76 | 152 | 69 | 116 | 174 |
| 2015 | 229 | 176 | 290 | 192 | 307 | 268 | 284 | 309 | 225 | 304 | 178 | 221 |
| 2016 | 223 | 286 | 233 | 290 | 281 | 252 | 346 | 352 | 284 | 299 | 251 | 268 |
| 2017 | 275 | 389 | 236 | 351 | 329 | 325 | 293 | 247 | 241 | 201 | 315 | 176 |
| 2018 | 189 | 297 | 254 | 396 | 337 | 256 | 283 | 319 | 234 | 474 | 477 | 642 |
| 2019 | 632 | 660 | 552 | 497 | 569 | 557 | 649 | 421 | 498 | 526 | 753 | 407 |
| 2020 | 715 | 463 | 441 | 429 | 681 | 503 | 485 | 626 | 464 | 447 | 582 | 214 |
| 2021 | 267 | 295 | 315 | 288 | 379 | 587 | 479 | 637 | 575 | 614 | 483 | 603 |
| 2022 | 666 | 832 | 722 | 781 | 975 | 727 | 761 | 613 | 871 | 766 | 773 | 1,097 |
| 2023 | 928 | 681 | 706 | 904 | 835 | 645 | 831 | 766 | 983 | 614 | 706 | 914 |
| 2024 | 955 | |||||||||||
| - = No Data Reported; -- = Not Applicable; NA = Not Available; W = Withheld to avoid disclosure of individual company data. |
| Release Date: 3/29/2024 |
| Next Release Date: 4/30/2024 |