|
Download Data (XLS File) |
|
||||||||
|
||||||||
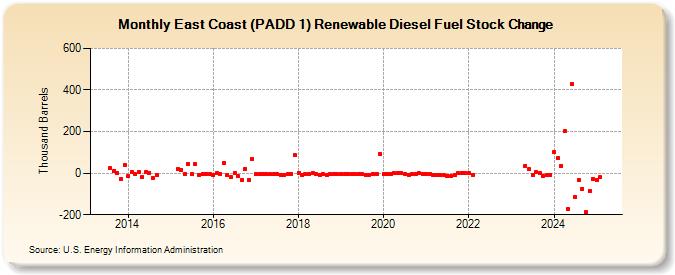
| East Coast (PADD 1) Renewable Diesel Fuel Stock Change (Thousand Barrels) | ||||||||
| Year | Jan | Feb | Mar | Apr | May | Jun | Jul | Aug | Sep | Oct | Nov | Dec |
|---|---|---|---|---|---|---|---|---|---|---|---|---|
| 2013 | 24 | 12 | 1 | -28 | 39 | |||||||
| 2014 | -14 | 6 | -5 | 7 | -18 | 5 | 2 | -22 | -9 | |||
| 2015 | 19 | 17 | -5 | 45 | -6 | 42 | -7 | -4 | -2 | -5 | ||
| 2016 | -10 | 0 | -4 | 48 | -10 | -18 | 1 | -16 | -33 | 21 | -35 | 70 |
| 2017 | -5 | -4 | -5 | -5 | -5 | -5 | -6 | -7 | -7 | -5 | -2 | 86 |
| 2018 | 0 | -10 | -4 | -5 | 0 | -5 | -8 | -6 | -8 | -5 | -2 | -5 |
| 2019 | -4 | -4 | -5 | -4 | -6 | -4 | -6 | -7 | -8 | -4 | -2 | 92 |
| 2020 | -5 | -4 | -3 | 0 | 0 | 0 | -2 | -7 | -4 | -4 | -1 | -2 |
| 2021 | -3 | -4 | -8 | -8 | -9 | -11 | -12 | -14 | -9 | 0 | 0 | 0 |
| 2022 | 0 | -8 | ||||||||||
| 2023 | 36 | 19 | -8 | 4 | -1 | -13 | -10 | -7 | ||||
| 2024 | 103 | |||||||||||
| - = No Data Reported; -- = Not Applicable; NA = Not Available; W = Withheld to avoid disclosure of individual company data. |
| Release Date: 3/29/2024 |
| Next Release Date: 4/30/2024 |