|
Download Data (XLS File) |
|
||||||||
|
||||||||
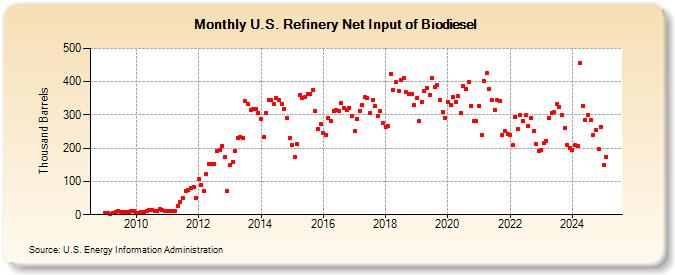
| U.S. Refinery Net Input of Biodiesel (Thousand Barrels) | ||||||||
| Year | Jan | Feb | Mar | Apr | May | Jun | Jul | Aug | Sep | Oct | Nov | Dec |
|---|---|---|---|---|---|---|---|---|---|---|---|---|
| 2009 | 4 | 4 | 3 | 6 | 8 | 10 | 8 | 8 | 8 | 7 | 11 | 10 |
| 2010 | 6 | 6 | 7 | 8 | 12 | 14 | 14 | 10 | 12 | 16 | 13 | 11 |
| 2011 | 11 | 12 | 12 | 11 | 27 | 38 | 51 | 70 | 74 | 80 | 84 | 49 |
| 2012 | 108 | 90 | 72 | 121 | 152 | 152 | 151 | 193 | 195 | 208 | 174 | 70 |
| 2013 | 149 | 159 | 191 | 232 | 235 | 230 | 342 | 334 | 316 | 317 | 318 | 306 |
| 2014 | 289 | 235 | 307 | 345 | 344 | 334 | 352 | 345 | 333 | 319 | 292 | 232 |
| 2015 | 211 | 174 | 212 | 359 | 351 | 353 | 364 | 362 | 376 | 312 | 259 | 272 |
| 2016 | 245 | 239 | 292 | 281 | 311 | 316 | 311 | 335 | 320 | 314 | 322 | 296 |
| 2017 | 253 | 287 | 312 | 330 | 353 | 351 | 306 | 346 | 327 | 296 | 311 | 277 |
| 2018 | 265 | 266 | 424 | 374 | 399 | 372 | 406 | 412 | 368 | 363 | 364 | 331 |
| 2019 | 351 | 281 | 339 | 371 | 382 | 360 | 410 | 383 | 390 | 345 | 310 | 291 |
| 2020 | 338 | 330 | 354 | 340 | 356 | 307 | 388 | 378 | 400 | 328 | 283 | 283 |
| 2021 | 328 | 241 | 401 | 426 | 377 | 346 | 315 | 344 | 343 | 240 | 253 | 243 |
| 2022 | 241 | 209 | 295 | 258 | 299 | 282 | 299 | 267 | 291 | 252 | 213 | 193 |
| 2023 | 192 | 217 | 223 | 291 | 305 | 311 | 333 | 324 | 299 | 260 | 209 | 202 |
| 2024 | 195 | |||||||||||
| - = No Data Reported; -- = Not Applicable; NA = Not Available; W = Withheld to avoid disclosure of individual company data. |
| Release Date: 3/29/2024 |
| Next Release Date: 4/30/2024 |
Referring Pages: