|
Download Data (XLS File) |
|
||||||||
|
||||||||
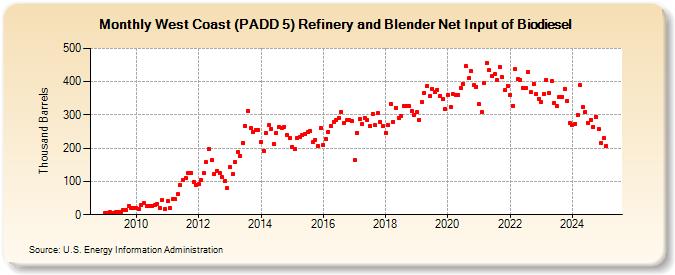
| West Coast (PADD 5) Refinery and Blender Net Input of Biodiesel (Thousand Barrels) | ||||||||
| Year | Jan | Feb | Mar | Apr | May | Jun | Jul | Aug | Sep | Oct | Nov | Dec |
|---|---|---|---|---|---|---|---|---|---|---|---|---|
| 2009 | 4 | 4 | 7 | 5 | 7 | 7 | 7 | 13 | 13 | 26 | 20 | 19 |
| 2010 | 20 | 17 | 28 | 34 | 26 | 26 | 27 | 29 | 32 | 21 | 43 | 16 |
| 2011 | 40 | 20 | 46 | 46 | 61 | 89 | 104 | 111 | 125 | 126 | 99 | 90 |
| 2012 | 91 | 104 | 125 | 157 | 199 | 165 | 122 | 131 | 125 | 113 | 100 | 79 |
| 2013 | 143 | 122 | 158 | 188 | 178 | 217 | 266 | 312 | 260 | 249 | 254 | 255 |
| 2014 | 220 | 193 | 245 | 269 | 259 | 214 | 246 | 265 | 261 | 265 | 241 | 230 |
| 2015 | 205 | 199 | 231 | 235 | 239 | 244 | 248 | 251 | 218 | 226 | 207 | 261 |
| 2016 | 209 | 227 | 249 | 267 | 280 | 285 | 292 | 310 | 276 | 284 | 285 | 281 |
| 2017 | 163 | 247 | 287 | 273 | 291 | 286 | 267 | 304 | 269 | 305 | 278 | 267 |
| 2018 | 247 | 270 | 334 | 280 | 322 | 292 | 297 | 327 | 326 | 327 | 312 | 301 |
| 2019 | 308 | 285 | 340 | 366 | 387 | 357 | 379 | 368 | 376 | 357 | 347 | 318 |
| 2020 | 361 | 324 | 362 | 359 | 360 | 380 | 393 | 446 | 410 | 432 | 389 | 385 |
| 2021 | 332 | 309 | 397 | 457 | 435 | 417 | 422 | 404 | 445 | 413 | 374 | 388 |
| 2022 | 361 | 328 | 437 | 407 | 406 | 382 | 382 | 429 | 368 | 394 | 362 | 349 |
| 2023 | 338 | 346 | 405 | 367 | 401 | 337 | 326 | 355 | 355 | 379 | 343 | 275 |
| 2024 | 271 | 273 | 301 | 389 | ||||||||
| - = No Data Reported; -- = Not Applicable; NA = Not Available; W = Withheld to avoid disclosure of individual company data. |
| Release Date: 6/28/2024 |
| Next Release Date: 7/31/2024 |