|
Download Data (XLS File) |
|
||||||||
|
||||||||
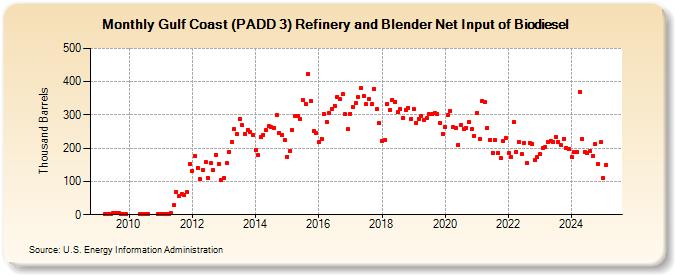
| Gulf Coast (PADD 3) Refinery and Blender Net Input of Biodiesel (Thousand Barrels) | ||||||||
| Year | Jan | Feb | Mar | Apr | May | Jun | Jul | Aug | Sep | Oct | Nov | Dec |
|---|---|---|---|---|---|---|---|---|---|---|---|---|
| 2009 | 2 | 3 | 3 | 4 | 4 | 4 | 3 | 2 | 1 | |||
| 2010 | 2 | 1 | 2 | 1 | 1 | |||||||
| 2011 | 1 | 1 | 1 | 2 | 4 | 28 | 69 | 55 | 63 | 58 | 67 | 152 |
| 2012 | 132 | 178 | 141 | 106 | 135 | 157 | 110 | 154 | 134 | 181 | 153 | 104 |
| 2013 | 111 | 154 | 189 | 220 | 257 | 243 | 289 | 269 | 244 | 256 | 248 | 241 |
| 2014 | 194 | 179 | 235 | 241 | 254 | 266 | 263 | 262 | 300 | 245 | 241 | 225 |
| 2015 | 175 | 191 | 254 | 298 | 297 | 287 | 346 | 334 | 423 | 341 | 252 | 245 |
| 2016 | 218 | 229 | 304 | 278 | 305 | 318 | 328 | 355 | 347 | 362 | 302 | 258 |
| 2017 | 304 | 325 | 335 | 353 | 381 | 357 | 332 | 347 | 332 | 379 | 317 | 275 |
| 2018 | 221 | 224 | 333 | 315 | 346 | 339 | 308 | 318 | 291 | 316 | 322 | 287 |
| 2019 | 317 | 277 | 288 | 298 | 284 | 291 | 302 | 302 | 306 | 303 | 277 | 244 |
| 2020 | 264 | 301 | 312 | 263 | 260 | 211 | 271 | 258 | 261 | 280 | 257 | 238 |
| 2021 | 306 | 227 | 343 | 338 | 262 | 226 | 187 | 225 | 187 | 169 | 222 | 231 |
| 2022 | 185 | 173 | 280 | 189 | 220 | 182 | 216 | 155 | 217 | 213 | 163 | 172 |
| 2023 | 170 | 192 | 246 | 211 | 209 | 209 | 234 | 204 | 201 | 215 | 190 | 193 |
| 2024 | 174 | 190 | 188 | 370 | ||||||||
| - = No Data Reported; -- = Not Applicable; NA = Not Available; W = Withheld to avoid disclosure of individual company data. |
| Release Date: 6/28/2024 |
| Next Release Date: 7/31/2024 |