|
Download Data (XLS File) |
|
||||||||
|
||||||||
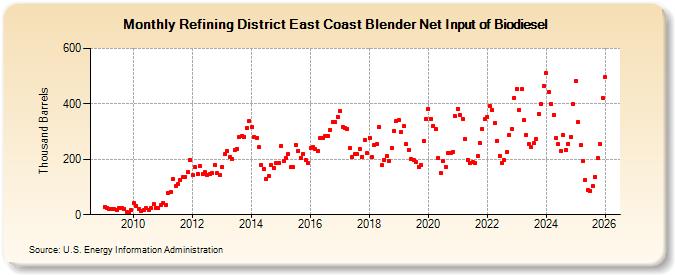
| Refining District East Coast Blender Net Input of Biodiesel (Thousand Barrels) | ||||||||
| Year | Jan | Feb | Mar | Apr | May | Jun | Jul | Aug | Sep | Oct | Nov | Dec |
|---|---|---|---|---|---|---|---|---|---|---|---|---|
| 2009 | 29 | 26 | 22 | 21 | 20 | 16 | 24 | 23 | 21 | 11 | 6 | 16 |
| 2010 | 41 | 33 | 21 | 12 | 17 | 24 | 17 | 23 | 38 | 26 | 25 | 35 |
| 2011 | 43 | 36 | 79 | 83 | 130 | 102 | 109 | 126 | 135 | 137 | 153 | 199 |
| 2012 | 142 | 171 | 147 | 174 | 146 | 154 | 144 | 146 | 150 | 179 | 149 | 143 |
| 2013 | 173 | 218 | 231 | 207 | 202 | 232 | 238 | 281 | 285 | 281 | 314 | 339 |
| 2014 | 315 | 281 | 278 | 243 | 180 | 165 | 130 | 140 | 179 | 168 | 187 | 188 |
| 2015 | 248 | 194 | 204 | 219 | 171 | 171 | 253 | 230 | 205 | 220 | 197 | 185 |
| 2016 | 240 | 245 | 236 | 231 | 275 | 275 | 284 | 284 | 307 | 336 | 335 | 354 |
| 2017 | 374 | 318 | 313 | 310 | 239 | 210 | 218 | 218 | 236 | 210 | 271 | 221 |
| 2018 | 278 | 207 | 251 | 254 | 316 | 178 | 198 | 211 | 194 | 242 | 303 | 337 |
| 2019 | 340 | 298 | 319 | 255 | 235 | 201 | 196 | 190 | 173 | 180 | 267 | 344 |
| 2020 | 382 | 347 | 321 | 309 | 206 | 149 | 192 | 173 | 221 | 224 | 228 | 355 |
| 2021 | 383 | 359 | 346 | 272 | 199 | 187 | 189 | 187 | 212 | 260 | 309 | 345 |
| 2022 | 354 | 392 | 377 | 330 | 267 | 212 | 187 | 197 | 227 | 286 | 310 | 422 |
| 2023 | 455 | 378 | 452 | 340 | 288 | 254 | 244 | 257 | 268 | 364 | 398 | 465 |
| 2024 | 504 | |||||||||||
| - = No Data Reported; -- = Not Applicable; NA = Not Available; W = Withheld to avoid disclosure of individual company data. |
| Release Date: 3/29/2024 |
| Next Release Date: 4/30/2024 |
Referring Pages: