|
Download Data (XLS File) |
|
||||||||
|
||||||||
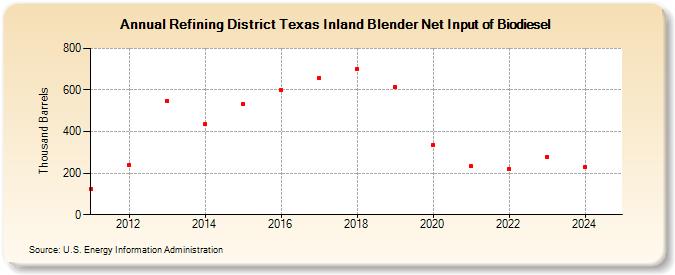
| Refining District Texas Inland Blender Net Input of Biodiesel (Thousand Barrels) | ||||||||
| Decade | Year-0 | Year-1 | Year-2 | Year-3 | Year-4 | Year-5 | Year-6 | Year-7 | Year-8 | Year-9 |
|---|---|---|---|---|---|---|---|---|---|---|
| 2010's | 125 | 238 | 549 | 435 | 532 | 601 | 659 | 700 | 615 | |
| 2020's | 337 | 233 | 220 | 279 |
| - = No Data Reported; -- = Not Applicable; NA = Not Available; W = Withheld to avoid disclosure of individual company data. |
| Release Date: 3/29/2024 |
| Next Release Date: 8/30/2024 |
Referring Pages: