|
Download Data (XLS File) |
|
||||||||
|
||||||||
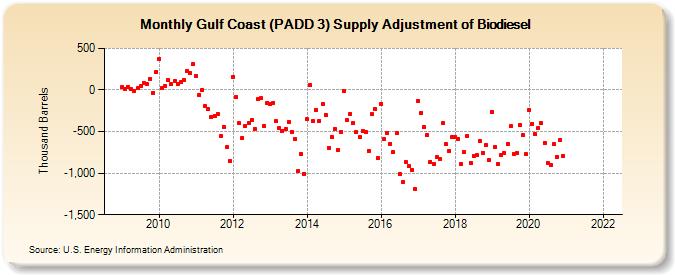
| Gulf Coast (PADD 3) Supply Adjustment of Biodiesel (Thousand Barrels) | ||||||||
| Year | Jan | Feb | Mar | Apr | May | Jun | Jul | Aug | Sep | Oct | Nov | Dec |
|---|---|---|---|---|---|---|---|---|---|---|---|---|
| 2009 | 34 | 17 | 39 | 8 | -10 | 19 | 46 | 78 | 68 | 132 | -32 | 218 |
| 2010 | 378 | 27 | 50 | 115 | 67 | 107 | 70 | 91 | 117 | 234 | 206 | 310 |
| 2011 | 173 | -57 | 2 | -197 | -230 | -321 | -311 | -283 | -551 | -445 | -687 | -854 |
| 2012 | 160 | -87 | -401 | -574 | -434 | -392 | -361 | -468 | -113 | -101 | -435 | -152 |
| 2013 | -164 | -153 | -379 | -463 | -490 | -466 | -385 | -501 | -585 | -980 | -771 | -1,005 |
| 2014 | -353 | 59 | -377 | -238 | -371 | -168 | -297 | -697 | -567 | -465 | -721 | -500 |
| 2015 | -14 | -364 | -288 | -400 | -509 | -566 | -493 | -511 | -728 | -294 | -230 | -813 |
| 2016 | -165 | -584 | -512 | -644 | -750 | -523 | -1,012 | -1,110 | -869 | -918 | -962 | -1,194 |
| 2017 | -131 | -276 | -446 | -544 | -861 | -885 | -810 | -828 | -398 | -653 | -733 | -565 |
| 2018 | -563 | -584 | -893 | -750 | -555 | -874 | -792 | -784 | -613 | -753 | -663 | -845 |
| 2019 | -260 | -687 | -886 | -780 | -757 | -649 | -437 | -764 | -756 | -427 | -547 | -773 |
| 2020 | -237 | -405 | -534 | -459 | -402 | -633 | -875 | -908 | -652 | -800 | -597 | -797 |
| 2022 | -- | |||||||||||
| - = No Data Reported; -- = Not Applicable; NA = Not Available; W = Withheld to avoid disclosure of individual company data. |
| Release Date: 6/28/2024 |
| Next Release Date: 7/31/2024 |