|
Download Data (XLS File) |
|
||||||||
|
||||||||
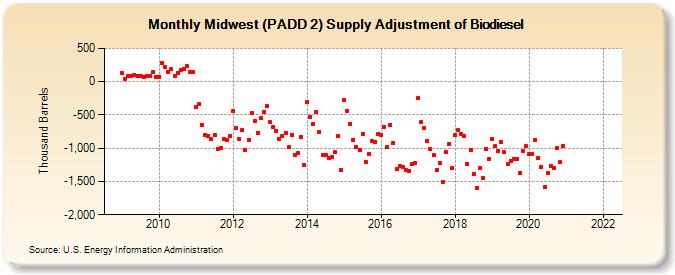
| Midwest (PADD 2) Supply Adjustment of Biodiesel (Thousand Barrels) | ||||||||
| Year | Jan | Feb | Mar | Apr | May | Jun | Jul | Aug | Sep | Oct | Nov | Dec |
|---|---|---|---|---|---|---|---|---|---|---|---|---|
| 2009 | 135 | 46 | 81 | 78 | 105 | 87 | 78 | 66 | 85 | 86 | 138 | 73 |
| 2010 | 76 | 276 | 219 | 149 | 185 | 83 | 129 | 181 | 183 | 232 | 139 | 140 |
| 2011 | -385 | -333 | -646 | -805 | -812 | -867 | -807 | -1,009 | -999 | -869 | -879 | -813 |
| 2012 | -446 | -699 | -860 | -722 | -1,026 | -870 | -465 | -593 | -766 | -543 | -452 | -364 |
| 2013 | -610 | -675 | -747 | -862 | -820 | -768 | -987 | -796 | -1,096 | -1,079 | -826 | -1,259 |
| 2014 | -302 | -530 | -641 | -457 | -752 | -1,107 | -1,097 | -1,155 | -1,125 | -1,058 | -813 | -1,327 |
| 2015 | -269 | -434 | -633 | -872 | -981 | -1,029 | -789 | -1,210 | -1,084 | -889 | -914 | -784 |
| 2016 | -802 | -675 | -986 | -647 | -925 | -1,313 | -1,268 | -1,282 | -1,335 | -1,338 | -1,237 | -1,230 |
| 2017 | -250 | -613 | -696 | -896 | -1,018 | -1,103 | -1,326 | -1,220 | -1,514 | -1,055 | -941 | -1,298 |
| 2018 | -807 | -731 | -783 | -821 | -1,235 | -1,023 | -1,391 | -1,599 | -1,302 | -1,449 | -1,007 | -1,164 |
| 2019 | -857 | -973 | -1,045 | -912 | -1,064 | -1,243 | -1,190 | -1,161 | -1,159 | -1,370 | -1,049 | -974 |
| 2020 | -1,092 | -1,085 | -872 | -1,147 | -1,276 | -1,581 | -1,372 | -1,266 | -1,292 | -1,000 | -1,212 | -969 |
| 2022 | -- | |||||||||||
| - = No Data Reported; -- = Not Applicable; NA = Not Available; W = Withheld to avoid disclosure of individual company data. |
| Release Date: 3/29/2024 |
| Next Release Date: 4/30/2024 |
Referring Pages: