|
Download Data (XLS File) |
|
||||||||
|
||||||||
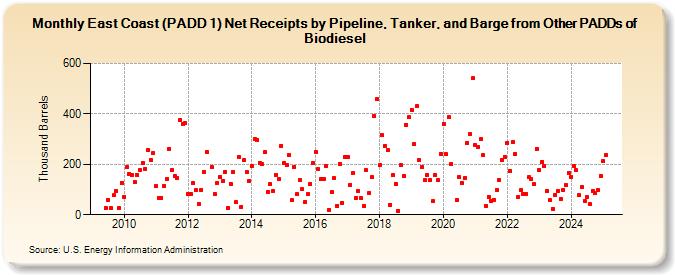
| East Coast (PADD 1) Net Receipts by Pipeline, Tanker, and Barge from Other PADDs of Biodiesel (Thousand Barrels) | ||||||||
| Year | Jan | Feb | Mar | Apr | May | Jun | Jul | Aug | Sep | Oct | Nov | Dec |
|---|---|---|---|---|---|---|---|---|---|---|---|---|
| 2009 | 27 | 60 | 27 | 77 | 94 | 27 | 127 | |||||
| 2010 | 72 | 189 | 163 | 158 | 131 | 159 | 176 | 206 | 183 | 257 | 219 | 244 |
| 2011 | 112 | 68 | 68 | 115 | 142 | 262 | 178 | 155 | 145 | 377 | 360 | 362 |
| 2012 | 82 | 82 | 125 | 97 | 43 | 99 | 171 | 249 | 189 | 82 | 125 | |
| 2013 | 151 | 135 | 171 | 27 | 121 | 168 | 49 | 228 | 32 | 217 | 169 | 135 |
| 2014 | 194 | 301 | 297 | 207 | 200 | 247 | 91 | 121 | 93 | 159 | 140 | 274 |
| 2015 | 204 | 199 | 237 | 57 | 191 | 81 | 136 | 101 | 51 | 81 | 122 | 204 |
| 2016 | 250 | 180 | 141 | 141 | 195 | 20 | 90 | 144 | 36 | 203 | 47 | 229 |
| 2017 | 228 | 119 | 164 | 68 | 95 | 68 | 35 | 176 | 87 | 148 | 392 | 458 |
| 2018 | 196 | 315 | 274 | 255 | 40 | 158 | 123 | 16 | 198 | 154 | 357 | 386 |
| 2019 | 417 | 281 | 430 | 217 | 190 | 136 | 158 | 137 | 53 | 157 | 137 | 241 |
| 2020 | 359 | 239 | 386 | 201 | 60 | 149 | 126 | 147 | 285 | 320 | 541 | |
| 2021 | 276 | 269 | 299 | 235 | 36 | 71 | 53 | 60 | 99 | 138 | 219 | 229 |
| 2022 | 286 | 175 | 289 | 242 | 70 | 97 | 81 | 84 | 148 | 141 | 120 | 262 |
| 2023 | 178 | 211 | 192 | 95 | 58 | 24 | 80 | 95 | 62 | 100 | 110 | 157 |
| 2024 | 145 | |||||||||||
| - = No Data Reported; -- = Not Applicable; NA = Not Available; W = Withheld to avoid disclosure of individual company data. |
| Release Date: 3/29/2024 |
| Next Release Date: 4/30/2024 |