|
Download Data (XLS File) |
|
||||||||
|
||||||||
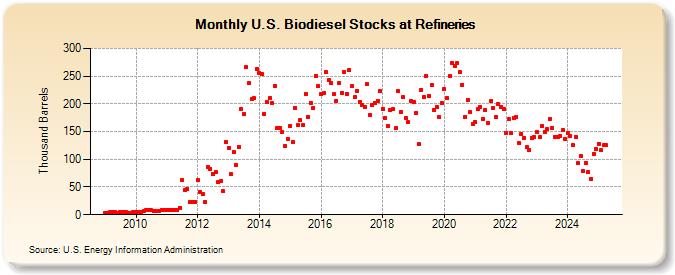
| U.S. Biodiesel Stocks at Refineries (Thousand Barrels) | ||||||||
| Year | Jan | Feb | Mar | Apr | May | Jun | Jul | Aug | Sep | Oct | Nov | Dec |
|---|---|---|---|---|---|---|---|---|---|---|---|---|
| 2009 | 3 | 3 | 4 | 4 | 4 | 3 | 4 | 4 | 4 | 3 | 3 | 4 |
| 2010 | 5 | 5 | 4 | 7 | 8 | 8 | 8 | 7 | 7 | 7 | 9 | 8 |
| 2011 | 8 | 8 | 9 | 9 | 8 | 13 | 62 | 45 | 46 | 23 | 23 | 23 |
| 2012 | 63 | 41 | 37 | 23 | 86 | 83 | 74 | 77 | 59 | 60 | 42 | 131 |
| 2013 | 121 | 73 | 113 | 90 | 123 | 191 | 181 | 266 | 237 | 208 | 210 | 262 |
| 2014 | 255 | 253 | 182 | 203 | 210 | 201 | 233 | 156 | 156 | 149 | 124 | 137 |
| 2015 | 160 | 132 | 193 | 161 | 170 | 161 | 218 | 177 | 202 | 193 | 251 | 232 |
| 2016 | 218 | 219 | 257 | 243 | 238 | 217 | 206 | 238 | 220 | 258 | 218 | 261 |
| 2017 | 232 | 212 | 223 | 204 | 198 | 195 | 235 | 180 | 197 | 202 | 206 | 223 |
| 2018 | 191 | 175 | 160 | 189 | 190 | 156 | 223 | 185 | 212 | 174 | 167 | 205 |
| 2019 | 204 | 184 | 127 | 225 | 212 | 251 | 215 | 234 | 188 | 194 | 176 | 201 |
| 2020 | 226 | 210 | 251 | 274 | 268 | 274 | 257 | 234 | 177 | 207 | 185 | 164 |
| 2021 | 167 | 190 | 195 | 173 | 189 | 166 | 205 | 193 | 177 | 200 | 195 | 191 |
| 2022 | 147 | 172 | 147 | 175 | 176 | 129 | 145 | 139 | 122 | 117 | 139 | 140 |
| 2023 | 150 | 140 | 159 | 149 | 154 | 174 | 158 | 141 | 141 | 142 | 153 | 136 |
| 2024 | 147 | |||||||||||
| - = No Data Reported; -- = Not Applicable; NA = Not Available; W = Withheld to avoid disclosure of individual company data. |
| Release Date: 3/29/2024 |
| Next Release Date: 4/30/2024 |
Referring Pages: