|
Download Data (XLS File) |
|
||||||||
|
||||||||
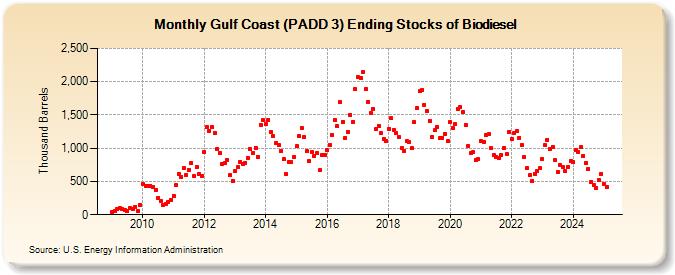
| Gulf Coast (PADD 3) Ending Stocks of Biodiesel (Thousand Barrels) | ||||||||
| Year | Jan | Feb | Mar | Apr | May | Jun | Jul | Aug | Sep | Oct | Nov | Dec |
|---|---|---|---|---|---|---|---|---|---|---|---|---|
| 2009 | 34 | 51 | 90 | 96 | 83 | 72 | 54 | 101 | 88 | 123 | 62 | 152 |
| 2010 | 458 | 427 | 438 | 438 | 417 | 364 | 256 | 209 | 143 | 163 | 184 | 226 |
| 2011 | 286 | 440 | 614 | 572 | 698 | 600 | 673 | 778 | 584 | 721 | 605 | 585 |
| 2012 | 945 | 1,312 | 1,265 | 1,312 | 1,234 | 983 | 930 | 762 | 781 | 824 | 590 | 505 |
| 2013 | 659 | 717 | 796 | 769 | 774 | 855 | 985 | 931 | 1,009 | 873 | 1,355 | 1,422 |
| 2014 | 1,363 | 1,428 | 1,243 | 1,179 | 1,085 | 1,050 | 959 | 831 | 614 | 794 | 788 | 871 |
| 2015 | 1,028 | 1,185 | 1,308 | 1,170 | 953 | 800 | 948 | 890 | 927 | 668 | 895 | 904 |
| 2016 | 967 | 1,052 | 1,200 | 1,425 | 1,333 | 1,687 | 1,396 | 1,155 | 1,249 | 1,503 | 1,399 | 1,883 |
| 2017 | 2,065 | 2,049 | 2,149 | 1,891 | 1,700 | 1,531 | 1,592 | 1,283 | 1,339 | 1,222 | 1,135 | 1,108 |
| 2018 | 1,293 | 1,453 | 1,279 | 1,223 | 1,170 | 1,004 | 964 | 1,102 | 1,089 | 1,000 | 1,393 | 1,597 |
| 2019 | 1,854 | 1,879 | 1,653 | 1,555 | 1,415 | 1,175 | 1,266 | 1,324 | 1,146 | 1,158 | 1,214 | 1,105 |
| 2020 | 1,392 | 1,305 | 1,358 | 1,592 | 1,615 | 1,544 | 1,345 | 1,033 | 926 | 938 | 826 | 832 |
| 2021 | 1,108 | 1,098 | 1,194 | 1,210 | 997 | 900 | 868 | 846 | 905 | 1,003 | 913 | 1,249 |
| 2022 | 1,140 | 1,231 | 1,258 | 1,159 | 1,048 | 869 | 701 | 592 | 510 | 612 | 660 | 695 |
| 2023 | 845 | 1,054 | 1,127 | 988 | 1,023 | 822 | 640 | 764 | 710 | 662 | 739 | 822 |
| 2024 | 795 | 966 | 948 | 1,012 | ||||||||
| - = No Data Reported; -- = Not Applicable; NA = Not Available; W = Withheld to avoid disclosure of individual company data. |
| Release Date: 6/28/2024 |
| Next Release Date: 7/31/2024 |