|
Download Data (XLS File) |
|
||||||||
|
||||||||
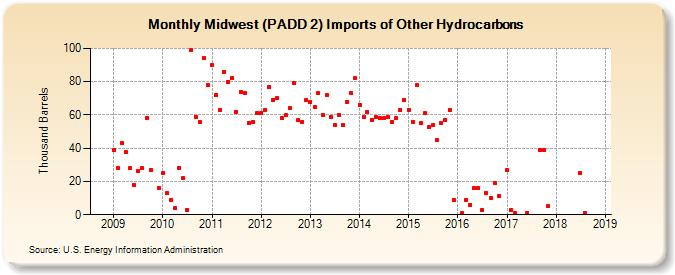
| Midwest (PADD 2) Imports of Other Hydrocarbons (Thousand Barrels) | ||||||||
| Year | Jan | Feb | Mar | Apr | May | Jun | Jul | Aug | Sep | Oct | Nov | Dec |
|---|---|---|---|---|---|---|---|---|---|---|---|---|
| 2009 | 39 | 28 | 43 | 38 | 28 | 18 | 26 | 28 | 58 | 27 | 16 | |
| 2010 | 25 | 13 | 9 | 4 | 28 | 22 | 3 | 99 | 59 | 56 | 94 | 78 |
| 2011 | 90 | 72 | 63 | 86 | 80 | 82 | 62 | 74 | 73 | 55 | 56 | 61 |
| 2012 | 61 | 63 | 77 | 69 | 70 | 58 | 60 | 64 | 79 | 57 | 56 | 69 |
| 2013 | 68 | 65 | 73 | 60 | 72 | 59 | 54 | 60 | 54 | 68 | 73 | 82 |
| 2014 | 66 | 59 | 62 | 57 | 59 | 58 | 58 | 59 | 56 | 58 | 63 | 69 |
| 2015 | 63 | 56 | 78 | 55 | 61 | 53 | 54 | 45 | 55 | 57 | 63 | 9 |
| 2016 | 1 | 9 | 6 | 16 | 16 | 3 | 13 | 10 | 19 | 11 | ||
| 2017 | 27 | 3 | 1 | 1 | 39 | 39 | 5 | |||||
| 2018 | 25 | 1 | ||||||||||
| - = No Data Reported; -- = Not Applicable; NA = Not Available; W = Withheld to avoid disclosure of individual company data. |
| Release Date: 3/29/2024 |
| Next Release Date: 4/30/2024 |