|
Download Data (XLS File) |
|
||||||||
|
||||||||
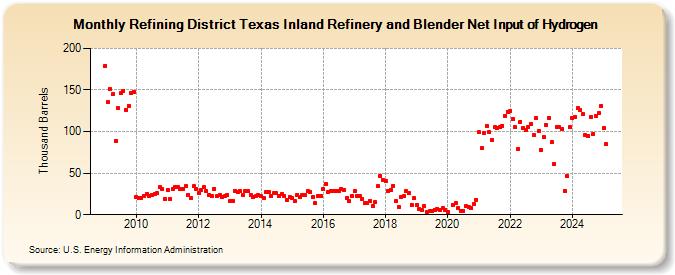
| Refining District Texas Inland Refinery and Blender Net Input of Hydrogen (Thousand Barrels) | ||||||||
| Year | Jan | Feb | Mar | Apr | May | Jun | Jul | Aug | Sep | Oct | Nov | Dec |
|---|---|---|---|---|---|---|---|---|---|---|---|---|
| 2009 | 179 | 135 | 151 | 145 | 89 | 128 | 146 | 149 | 126 | 131 | 146 | 148 |
| 2010 | 21 | 20 | 20 | 23 | 25 | 23 | 24 | 25 | 26 | 33 | 31 | 19 |
| 2011 | 30 | 19 | 31 | 33 | 33 | 31 | 31 | 34 | 24 | 20 | 34 | 31 |
| 2012 | 26 | 30 | 33 | 28 | 24 | 23 | 31 | 22 | 24 | 21 | 22 | 24 |
| 2013 | 16 | 17 | 29 | 27 | 28 | 24 | 28 | 28 | 24 | 21 | 22 | 24 |
| 2014 | 22 | 20 | 27 | 27 | 22 | 26 | 26 | 23 | 25 | 23 | 18 | 21 |
| 2015 | 20 | 16 | 24 | 21 | 24 | 24 | 28 | 27 | 21 | 14 | 23 | 23 |
| 2016 | 31 | 37 | 27 | 29 | 28 | 28 | 28 | 31 | 30 | 20 | 16 | 23 |
| 2017 | 28 | 23 | 22 | 19 | 14 | 14 | 17 | 11 | 15 | 34 | 47 | 42 |
| 2018 | 40 | 29 | 30 | 35 | 16 | 9 | 21 | 22 | 28 | 26 | 12 | 20 |
| 2019 | 12 | 7 | 6 | 10 | 3 | 4 | 5 | 6 | 7 | 6 | 8 | 6 |
| 2020 | 3 | 12 | 14 | 8 | 5 | 5 | 10 | 9 | 8 | 13 | 18 | |
| 2021 | 99 | 80 | 98 | 107 | 99 | 90 | 105 | 104 | 105 | 107 | 119 | 124 |
| 2022 | 125 | 115 | 105 | 79 | 112 | 104 | 102 | 106 | 109 | 96 | 116 | 101 |
| 2023 | 78 | 93 | 108 | 116 | 87 | 61 | 106 | 105 | 103 | 29 | 46 | 105 |
| 2024 | 116 | |||||||||||
| - = No Data Reported; -- = Not Applicable; NA = Not Available; W = Withheld to avoid disclosure of individual company data. |
| Release Date: 3/29/2024 |
| Next Release Date: 4/30/2024 |