|
Download Data (XLS File) |
|
||||||||
|
||||||||
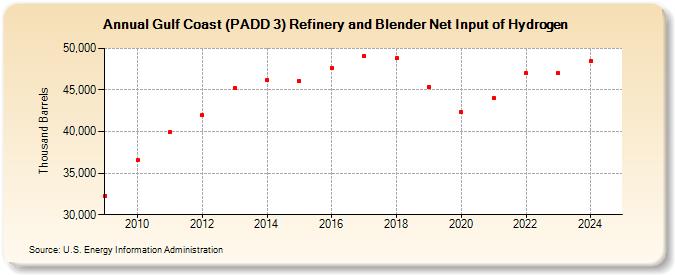
| Gulf Coast (PADD 3) Refinery and Blender Net Input of Hydrogen (Thousand Barrels) | ||||||||
| Decade | Year-0 | Year-1 | Year-2 | Year-3 | Year-4 | Year-5 | Year-6 | Year-7 | Year-8 | Year-9 |
|---|---|---|---|---|---|---|---|---|---|---|
| 2000's | 32,271 | |||||||||
| 2010's | 36,541 | 39,911 | 41,953 | 45,229 | 46,140 | 46,108 | 47,642 | 49,082 | 48,810 | 45,340 |
| 2020's | 42,340 | 44,058 | 46,998 | 47,054 |
| - = No Data Reported; -- = Not Applicable; NA = Not Available; W = Withheld to avoid disclosure of individual company data. |
| Release Date: 3/29/2024 |
| Next Release Date: 8/30/2024 |