|
Download Data (XLS File) |
|
||||||||
|
||||||||
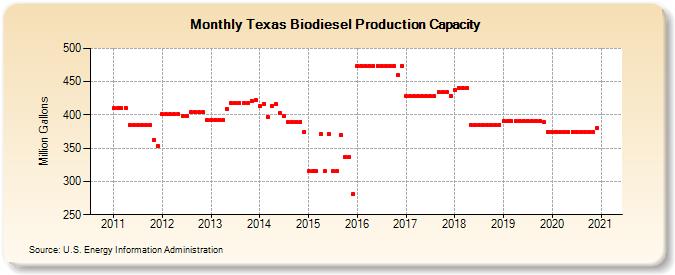
| Texas Biodiesel Production Capacity (Million Gallons) | ||||||||
| Year | Jan | Feb | Mar | Apr | May | Jun | Jul | Aug | Sep | Oct | Nov | Dec |
|---|---|---|---|---|---|---|---|---|---|---|---|---|
| 2011 | 410 | 410 | 410 | 410 | 385 | 385 | 385 | 385 | 385 | 385 | 363 | 353 |
| 2012 | 401 | 401 | 401 | 401 | 401 | 399 | 399 | 404 | 404 | 404 | 404 | 392 |
| 2013 | 393 | 393 | 393 | 393 | 409 | 418 | 418 | 418 | 418 | 418 | 421 | 422 |
| 2014 | 413 | 417 | 397 | 414 | 416 | 403 | 398 | 390 | 390 | 390 | 390 | 375 |
| 2015 | 315 | 315 | 315 | 371 | 315 | 371 | 315 | 315 | 370 | 337 | 337 | 281 |
| 2016 | 474 | 474 | 474 | 474 | 474 | 474 | 474 | 474 | 474 | 474 | 460 | 474 |
| 2017 | 428 | 428 | 428 | 428 | 428 | 428 | 428 | 428 | 434 | 434 | 434 | 429 |
| 2018 | 438 | 441 | 441 | 441 | 385 | 385 | 385 | 385 | 385 | 385 | 385 | 385 |
| 2019 | 391 | 391 | 391 | 391 | 391 | 391 | 391 | 391 | 391 | 391 | 389 | 375 |
| 2020 | 375 | 375 | 375 | 375 | 375 | 375 | 375 | 375 | 375 | 375 | 375 | 380 |
| - = No Data Reported; -- = Not Applicable; NA = Not Available; W = Withheld to avoid disclosure of individual company data. |
| Release Date: 4/30/2024 |
| Next Release Date: 5/31/2024 |
Referring Pages: