|
Download Data (XLS File) |
|
||||||||
|
||||||||
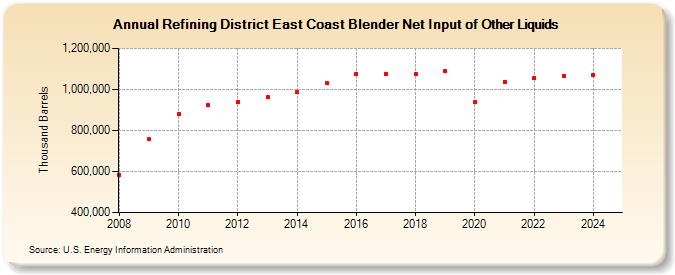
| Refining District East Coast Blender Net Input of Other Liquids (Thousand Barrels) | ||||||||
| Decade | Year-0 | Year-1 | Year-2 | Year-3 | Year-4 | Year-5 | Year-6 | Year-7 | Year-8 | Year-9 |
|---|---|---|---|---|---|---|---|---|---|---|
| 2000's | 585,310 | 758,147 | ||||||||
| 2010's | 878,664 | 924,086 | 937,781 | 962,493 | 986,244 | 1,031,594 | 1,076,879 | 1,075,608 | 1,077,028 | 1,088,656 |
| 2020's | 938,057 | 1,038,608 | 1,056,728 | 1,066,879 |
| - = No Data Reported; -- = Not Applicable; NA = Not Available; W = Withheld to avoid disclosure of individual company data. |
| Release Date: 3/29/2024 |
| Next Release Date: 8/30/2024 |
Referring Pages: