|
Download Data (XLS File) |
|
||||||||
|
||||||||
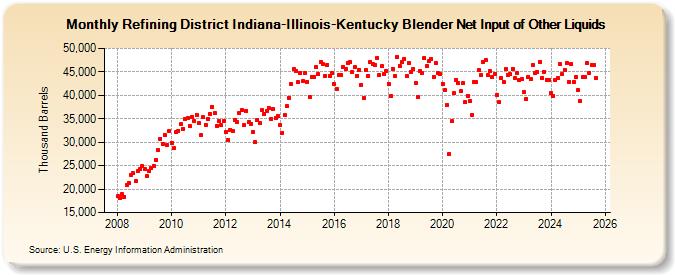
| Refining District Indiana-Illinois-Kentucky Blender Net Input of Other Liquids (Thousand Barrels) | ||||||||
| Year | Jan | Feb | Mar | Apr | May | Jun | Jul | Aug | Sep | Oct | Nov | Dec |
|---|---|---|---|---|---|---|---|---|---|---|---|---|
| 2008 | 18,467 | 18,031 | 18,889 | 18,417 | 20,966 | 21,408 | 23,098 | 23,338 | 21,719 | 23,825 | 24,233 | 24,880 |
| 2009 | 24,284 | 22,712 | 23,761 | 24,472 | 24,987 | 26,270 | 28,346 | 30,778 | 29,661 | 31,623 | 29,337 | 32,383 |
| 2010 | 29,912 | 28,660 | 32,079 | 32,460 | 33,812 | 32,908 | 35,033 | 35,123 | 33,382 | 35,460 | 34,485 | 35,879 |
| 2011 | 34,065 | 31,442 | 35,359 | 33,726 | 34,988 | 36,108 | 37,541 | 36,204 | 33,540 | 34,506 | 33,572 | 34,445 |
| 2012 | 32,275 | 30,494 | 32,636 | 32,493 | 34,661 | 34,318 | 36,191 | 36,839 | 33,570 | 36,746 | 34,263 | 33,978 |
| 2013 | 32,203 | 30,034 | 34,780 | 34,141 | 36,783 | 35,982 | 36,552 | 37,221 | 34,972 | 36,989 | 35,261 | 35,635 |
| 2014 | 33,770 | 32,010 | 35,762 | 37,644 | 39,428 | 42,508 | 45,610 | 45,183 | 42,753 | 44,729 | 42,953 | 44,858 |
| 2015 | 42,898 | 39,583 | 43,906 | 43,861 | 46,060 | 44,510 | 47,111 | 46,568 | 44,131 | 46,532 | 44,127 | 44,665 |
| 2016 | 42,426 | 41,361 | 44,344 | 44,356 | 46,029 | 45,691 | 46,951 | 47,053 | 44,949 | 45,962 | 44,220 | 45,394 |
| 2017 | 42,208 | 39,453 | 45,445 | 44,120 | 47,191 | 46,579 | 46,528 | 47,951 | 44,359 | 46,176 | 44,454 | 45,230 |
| 2018 | 42,510 | 39,763 | 45,682 | 44,081 | 48,145 | 46,319 | 47,045 | 47,799 | 44,020 | 46,986 | 44,989 | 45,589 |
| 2019 | 42,574 | 39,570 | 45,176 | 44,708 | 47,991 | 46,289 | 47,242 | 47,720 | 43,974 | 46,855 | 44,717 | 44,490 |
| 2020 | 42,493 | 41,070 | 37,958 | 27,442 | 34,459 | 40,399 | 43,313 | 42,569 | 40,834 | 42,521 | 38,474 | 39,919 |
| 2021 | 38,693 | 35,892 | 42,875 | 42,795 | 45,459 | 44,249 | 47,172 | 47,537 | 44,361 | 45,105 | 43,872 | 44,575 |
| 2022 | 40,084 | 38,481 | 43,687 | 42,930 | 45,645 | 44,424 | 44,466 | 45,613 | 43,642 | 44,809 | 43,216 | 43,380 |
| 2023 | 40,596 | 39,260 | 43,962 | 43,466 | 46,344 | 44,716 | 44,982 | 47,106 | 43,820 | 45,007 | 43,262 | 43,315 |
| 2024 | 40,224 | 39,738 | 43,157 | 43,599 | ||||||||
| - = No Data Reported; -- = Not Applicable; NA = Not Available; W = Withheld to avoid disclosure of individual company data. |
| Release Date: 6/28/2024 |
| Next Release Date: 7/31/2024 |