|
Download Data (XLS File) |
|
||||||||
|
||||||||
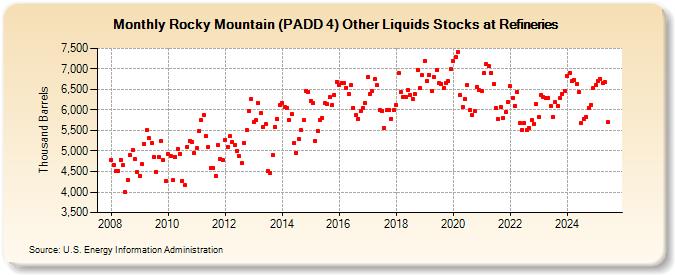
| Rocky Mountain (PADD 4) Other Liquids Stocks at Refineries (Thousand Barrels) | ||||||||
| Year | Jan | Feb | Mar | Apr | May | Jun | Jul | Aug | Sep | Oct | Nov | Dec |
|---|---|---|---|---|---|---|---|---|---|---|---|---|
| 2008 | 4,789 | 4,665 | 4,516 | 4,513 | 4,784 | 4,647 | 3,998 | 4,290 | 4,898 | 5,030 | 4,793 | 4,480 |
| 2009 | 4,399 | 4,672 | 5,177 | 5,507 | 5,307 | 5,193 | 4,865 | 4,485 | 4,856 | 5,232 | 4,771 | 4,263 |
| 2010 | 4,926 | 4,872 | 4,296 | 4,854 | 5,053 | 4,937 | 4,277 | 4,162 | 5,100 | 5,251 | 5,222 | 4,951 |
| 2011 | 5,072 | 5,494 | 5,748 | 5,869 | 5,363 | 5,093 | 4,582 | 4,587 | 4,397 | 5,140 | 4,817 | 4,774 |
| 2012 | 5,277 | 5,097 | 5,358 | 5,218 | 5,154 | 5,011 | 4,867 | 4,706 | 5,197 | 5,501 | 5,981 | 6,279 |
| 2013 | 5,705 | 5,747 | 6,176 | 5,921 | 5,591 | 5,657 | 4,511 | 4,473 | 4,891 | 5,592 | 5,781 | 6,110 |
| 2014 | 6,176 | 6,080 | 6,050 | 5,757 | 5,892 | 5,197 | 4,959 | 5,296 | 5,500 | 5,746 | 6,469 | 6,445 |
| 2015 | 6,227 | 6,167 | 5,254 | 5,488 | 5,758 | 5,804 | 6,169 | 6,135 | 6,306 | 6,113 | 6,371 | 6,685 |
| 2016 | 6,603 | 6,663 | 6,663 | 6,538 | 6,395 | 6,596 | 6,050 | 5,865 | 5,788 | 5,976 | 6,045 | 6,165 |
| 2017 | 6,810 | 6,385 | 6,461 | 6,757 | 6,600 | 6,003 | 5,980 | 5,569 | 5,989 | 6,001 | 5,787 | 6,009 |
| 2018 | 6,115 | 6,889 | 6,431 | 6,319 | 6,314 | 6,492 | 6,364 | 6,278 | 6,384 | 6,985 | 6,527 | 6,851 |
| 2019 | 7,192 | 6,713 | 6,861 | 6,459 | 6,801 | 6,968 | 6,654 | 6,643 | 6,524 | 6,662 | 6,694 | 6,996 |
| 2020 | 7,185 | 7,288 | 7,419 | 6,354 | 6,077 | 6,263 | 6,604 | 6,000 | 5,872 | 5,978 | 6,561 | 6,478 |
| 2021 | 6,458 | 6,906 | 7,116 | 7,064 | 6,902 | 6,627 | 6,046 | 5,772 | 6,084 | 5,809 | 5,945 | 6,188 |
| 2022 | 6,574 | 6,296 | 6,107 | 6,443 | 5,674 | 5,523 | 5,694 | 5,502 | 5,567 | 5,754 | 5,668 | 6,140 |
| 2023 | 5,824 | 6,387 | 6,319 | 6,280 | 6,296 | 6,040 | 5,826 | 6,190 | 6,121 | 6,290 | 6,397 | 6,459 |
| 2024 | 6,823 | |||||||||||
| - = No Data Reported; -- = Not Applicable; NA = Not Available; W = Withheld to avoid disclosure of individual company data. |
| Release Date: 3/29/2024 |
| Next Release Date: 4/30/2024 |