|
Download Data (XLS File) |
|
||||||||
|
||||||||
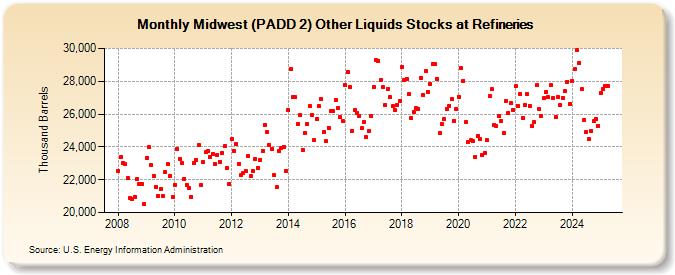
| Midwest (PADD 2) Other Liquids Stocks at Refineries (Thousand Barrels) | ||||||||
| Year | Jan | Feb | Mar | Apr | May | Jun | Jul | Aug | Sep | Oct | Nov | Dec |
|---|---|---|---|---|---|---|---|---|---|---|---|---|
| 2008 | 22,549 | 23,356 | 23,016 | 22,933 | 22,098 | 20,874 | 20,830 | 20,959 | 22,016 | 21,762 | 21,748 | 20,511 |
| 2009 | 23,347 | 23,976 | 22,880 | 22,231 | 21,585 | 21,033 | 21,457 | 21,023 | 22,464 | 22,941 | 22,252 | 20,937 |
| 2010 | 21,704 | 23,858 | 23,263 | 23,025 | 22,069 | 21,678 | 21,524 | 20,949 | 22,997 | 23,226 | 24,134 | 21,662 |
| 2011 | 23,059 | 23,682 | 23,763 | 23,408 | 23,573 | 22,954 | 23,523 | 23,095 | 23,630 | 24,039 | 22,719 | 21,765 |
| 2012 | 24,455 | 23,754 | 24,202 | 22,985 | 22,290 | 22,414 | 22,518 | 23,455 | 22,208 | 22,534 | 23,291 | 22,731 |
| 2013 | 23,230 | 23,766 | 25,317 | 24,884 | 24,117 | 23,889 | 22,258 | 21,534 | 23,764 | 23,962 | 23,995 | 22,551 |
| 2014 | 26,235 | 28,746 | 27,010 | 27,028 | 25,393 | 25,929 | 23,821 | 24,842 | 25,394 | 26,497 | 25,938 | 24,392 |
| 2015 | 25,724 | 26,472 | 26,896 | 24,896 | 24,335 | 25,174 | 26,178 | 26,199 | 26,861 | 26,365 | 25,799 | 25,569 |
| 2016 | 27,782 | 28,570 | 27,666 | 24,988 | 26,251 | 26,076 | 25,855 | 25,131 | 25,527 | 24,582 | 24,989 | 25,877 |
| 2017 | 27,640 | 29,272 | 29,254 | 28,084 | 27,620 | 26,555 | 27,547 | 27,014 | 26,468 | 26,255 | 26,555 | 26,794 |
| 2018 | 28,855 | 28,096 | 28,157 | 27,197 | 25,749 | 26,114 | 26,399 | 26,319 | 28,218 | 27,181 | 28,608 | 27,345 |
| 2019 | 27,832 | 29,061 | 29,057 | 28,145 | 24,840 | 25,379 | 25,693 | 26,314 | 26,521 | 26,902 | 25,600 | 26,308 |
| 2020 | 27,056 | 28,787 | 28,043 | 25,508 | 24,309 | 24,394 | 24,342 | 23,385 | 24,693 | 24,471 | 23,511 | 23,623 |
| 2021 | 24,397 | 27,114 | 27,497 | 25,336 | 25,273 | 25,858 | 25,599 | 24,871 | 26,792 | 26,086 | 26,673 | 26,267 |
| 2022 | 27,699 | 26,519 | 27,195 | 25,762 | 26,534 | 27,224 | 26,509 | 25,261 | 25,515 | 27,741 | 26,292 | 25,890 |
| 2023 | 26,953 | 27,347 | 27,015 | 27,740 | 26,965 | 25,834 | 27,016 | 26,550 | 26,989 | 27,390 | 27,983 | 26,681 |
| 2024 | 28,015 | |||||||||||
| - = No Data Reported; -- = Not Applicable; NA = Not Available; W = Withheld to avoid disclosure of individual company data. |
| Release Date: 3/29/2024 |
| Next Release Date: 4/30/2024 |