|
Download Data (XLS File) |
|
||||||||
|
||||||||
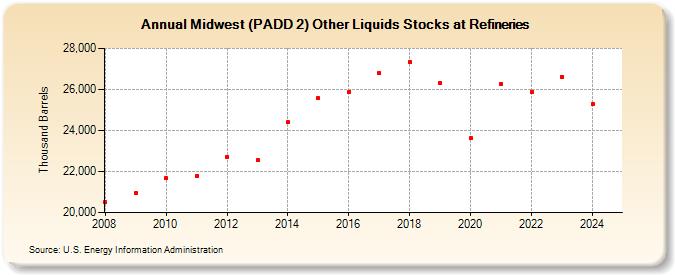
| Midwest (PADD 2) Other Liquids Stocks at Refineries (Thousand Barrels) | ||||||||
| Decade | Year-0 | Year-1 | Year-2 | Year-3 | Year-4 | Year-5 | Year-6 | Year-7 | Year-8 | Year-9 |
|---|---|---|---|---|---|---|---|---|---|---|
| 2000's | 20,511 | 20,937 | ||||||||
| 2010's | 21,662 | 21,765 | 22,731 | 22,551 | 24,392 | 25,569 | 25,877 | 26,794 | 27,345 | 26,308 |
| 2020's | 23,623 | 26,267 | 25,890 | 26,681 |
| - = No Data Reported; -- = Not Applicable; NA = Not Available; W = Withheld to avoid disclosure of individual company data. |
| Release Date: 4/30/2024 |
| Next Release Date: 8/30/2024 |