|
Download Data (XLS File) |
|
||||||||
|
||||||||
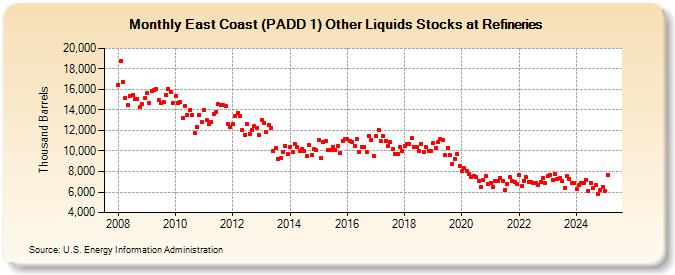
| East Coast (PADD 1) Other Liquids Stocks at Refineries (Thousand Barrels) | ||||||||
| Year | Jan | Feb | Mar | Apr | May | Jun | Jul | Aug | Sep | Oct | Nov | Dec |
|---|---|---|---|---|---|---|---|---|---|---|---|---|
| 2008 | 16,460 | 18,726 | 16,766 | 15,213 | 14,441 | 15,345 | 15,453 | 15,082 | 15,043 | 14,259 | 14,543 | 15,184 |
| 2009 | 15,627 | 14,649 | 15,837 | 15,961 | 16,003 | 14,938 | 14,662 | 14,789 | 15,459 | 16,080 | 15,736 | 14,688 |
| 2010 | 15,368 | 14,642 | 14,741 | 13,222 | 14,364 | 13,520 | 14,003 | 13,485 | 11,732 | 12,293 | 13,514 | 12,841 |
| 2011 | 13,984 | 12,986 | 12,628 | 12,828 | 13,639 | 13,802 | 14,533 | 14,521 | 14,448 | 14,431 | 12,678 | 12,324 |
| 2012 | 12,637 | 13,367 | 13,742 | 13,376 | 12,042 | 11,561 | 12,602 | 11,664 | 12,024 | 12,395 | 12,285 | 11,520 |
| 2013 | 12,995 | 12,696 | 11,824 | 12,520 | 12,264 | 9,984 | 10,295 | 9,250 | 9,275 | 9,923 | 10,515 | 9,665 |
| 2014 | 10,433 | 9,900 | 10,724 | 10,381 | 9,969 | 10,209 | 9,970 | 9,505 | 10,539 | 9,586 | 10,192 | 10,052 |
| 2015 | 11,094 | 9,302 | 10,875 | 10,966 | 10,092 | 10,052 | 10,406 | 10,049 | 10,496 | 9,796 | 11,003 | 11,149 |
| 2016 | 11,129 | 10,951 | 10,872 | 10,518 | 11,140 | 9,906 | 10,392 | 10,362 | 9,879 | 11,475 | 11,027 | 9,556 |
| 2017 | 11,510 | 12,088 | 10,926 | 11,488 | 11,003 | 10,488 | 10,892 | 10,184 | 9,722 | 9,705 | 10,378 | 9,986 |
| 2018 | 10,483 | 10,718 | 10,711 | 11,255 | 10,432 | 10,438 | 9,978 | 10,728 | 9,862 | 10,348 | 10,044 | 9,997 |
| 2019 | 10,756 | 10,329 | 10,870 | 11,125 | 11,066 | 9,625 | 10,310 | 9,650 | 8,763 | 9,259 | 9,694 | 8,499 |
| 2020 | 8,034 | 8,306 | 8,011 | 7,721 | 7,430 | 7,581 | 7,418 | 7,035 | 6,460 | 7,128 | 7,548 | 6,751 |
| 2021 | 6,897 | 6,489 | 7,116 | 7,084 | 7,382 | 7,076 | 6,196 | 6,810 | 7,438 | 7,117 | 6,947 | 6,817 |
| 2022 | 7,618 | 6,577 | 7,113 | 7,425 | 7,006 | 6,937 | 6,853 | 6,839 | 6,700 | 7,009 | 7,325 | 6,855 |
| 2023 | 7,589 | 7,680 | 7,181 | 7,725 | 7,229 | 7,414 | 7,053 | 6,356 | 7,552 | 7,272 | 6,907 | 6,883 |
| 2024 | 6,339 | 6,698 | 6,923 | 6,834 | ||||||||
| - = No Data Reported; -- = Not Applicable; NA = Not Available; W = Withheld to avoid disclosure of individual company data. |
| Release Date: 6/28/2024 |
| Next Release Date: 7/31/2024 |