|
Download Data (XLS File) |
|
||||||||
|
||||||||
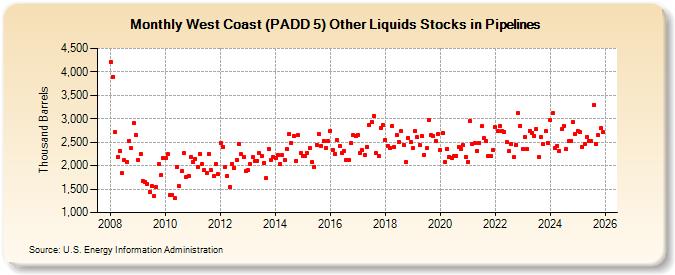
| West Coast (PADD 5) Other Liquids Stocks in Pipelines (Thousand Barrels) | ||||||||
| Year | Jan | Feb | Mar | Apr | May | Jun | Jul | Aug | Sep | Oct | Nov | Dec |
|---|---|---|---|---|---|---|---|---|---|---|---|---|
| 2008 | 4,216 | 3,894 | 2,717 | 2,185 | 2,314 | 1,834 | 2,110 | 2,083 | 2,531 | 2,368 | 2,902 | 2,644 |
| 2009 | 2,125 | 2,247 | 1,668 | 1,658 | 1,605 | 1,434 | 1,558 | 1,347 | 1,539 | 2,032 | 1,794 | 2,159 |
| 2010 | 2,161 | 2,246 | 1,372 | 1,378 | 1,307 | 1,972 | 1,558 | 1,877 | 2,267 | 1,762 | 1,785 | 2,175 |
| 2011 | 2,086 | 2,141 | 1,975 | 2,249 | 2,029 | 1,900 | 1,849 | 2,246 | 1,897 | 1,771 | 2,043 | 1,813 |
| 2012 | 2,477 | 2,401 | 1,976 | 1,784 | 1,542 | 2,042 | 1,945 | 2,126 | 2,463 | 2,243 | 2,193 | 1,890 |
| 2013 | 1,904 | 2,029 | 2,180 | 2,089 | 2,107 | 2,260 | 2,198 | 2,065 | 1,727 | 2,359 | 2,122 | 2,179 |
| 2014 | 2,158 | 2,221 | 2,044 | 2,219 | 2,122 | 2,353 | 2,677 | 2,488 | 2,642 | 2,104 | 2,644 | 2,264 |
| 2015 | 2,207 | 2,204 | 2,270 | 2,384 | 2,073 | 1,971 | 2,451 | 2,675 | 2,411 | 2,535 | 2,387 | 2,522 |
| 2016 | 2,748 | 2,327 | 2,244 | 2,543 | 2,415 | 2,273 | 2,319 | 2,117 | 2,127 | 2,479 | 2,652 | 2,627 |
| 2017 | 2,659 | 2,272 | 2,328 | 2,237 | 2,395 | 2,877 | 2,936 | 3,065 | 2,264 | 2,211 | 2,803 | 2,872 |
| 2018 | 2,555 | 2,418 | 2,377 | 2,846 | 2,402 | 2,664 | 2,505 | 2,730 | 2,445 | 2,080 | 2,600 | 2,507 |
| 2019 | 2,366 | 2,738 | 2,615 | 2,441 | 2,629 | 2,237 | 2,368 | 2,970 | 2,644 | 2,630 | 2,533 | 2,671 |
| 2020 | 2,342 | 2,705 | 2,074 | 2,363 | 2,194 | 2,158 | 2,208 | 2,211 | 2,391 | 2,357 | 2,431 | 2,180 |
| 2021 | 2,075 | 2,955 | 2,460 | 2,490 | 2,322 | 2,489 | 2,839 | 2,583 | 2,527 | 2,212 | 2,205 | 2,334 |
| 2022 | 2,821 | 2,729 | 2,843 | 2,735 | 2,718 | 2,495 | 2,308 | 2,465 | 2,177 | 2,446 | 3,113 | 2,851 |
| 2023 | 2,353 | 2,605 | 2,353 | 2,735 | 2,693 | 2,628 | 2,786 | 2,175 | 2,610 | 2,467 | 2,733 | 2,493 |
| 2024 | 2,971 | 3,113 | 2,798 | 2,427 | ||||||||
| - = No Data Reported; -- = Not Applicable; NA = Not Available; W = Withheld to avoid disclosure of individual company data. |
| Release Date: 6/28/2024 |
| Next Release Date: 7/31/2024 |