|
Download Data (XLS File) |
|
||||||||
|
||||||||
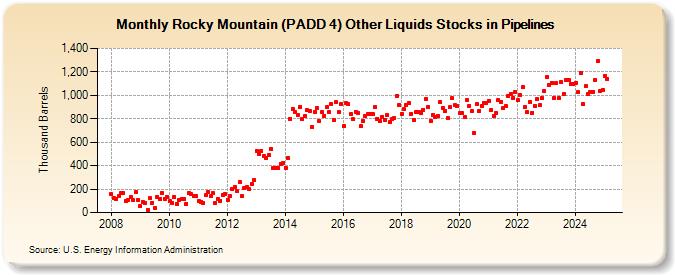
| Rocky Mountain (PADD 4) Other Liquids Stocks in Pipelines (Thousand Barrels) | ||||||||
| Year | Jan | Feb | Mar | Apr | May | Jun | Jul | Aug | Sep | Oct | Nov | Dec |
|---|---|---|---|---|---|---|---|---|---|---|---|---|
| 2008 | 158 | 123 | 113 | 137 | 164 | 165 | 101 | 104 | 134 | 106 | 174 | 110 |
| 2009 | 53 | 92 | 85 | 22 | 121 | 84 | 37 | 136 | 114 | 170 | 119 | 133 |
| 2010 | 95 | 85 | 135 | 76 | 106 | 118 | 112 | 77 | 165 | 155 | 144 | 140 |
| 2011 | 98 | 93 | 82 | 146 | 174 | 138 | 164 | 82 | 116 | 101 | 151 | 159 |
| 2012 | 111 | 139 | 197 | 222 | 181 | 258 | 140 | 212 | 217 | 198 | 247 | 277 |
| 2013 | 529 | 498 | 526 | 483 | 465 | 490 | 543 | 378 | 381 | 378 | 418 | 423 |
| 2014 | 383 | 465 | 801 | 883 | 857 | 830 | 904 | 794 | 822 | 871 | 863 | 733 |
| 2015 | 861 | 894 | 781 | 855 | 826 | 899 | 859 | 925 | 787 | 942 | 857 | 929 |
| 2016 | 736 | 932 | 927 | 840 | 795 | 861 | 851 | 736 | 781 | 822 | 838 | 841 |
| 2017 | 841 | 898 | 802 | 781 | 815 | 793 | 833 | 769 | 795 | 806 | 994 | 917 |
| 2018 | 843 | 883 | 918 | 934 | 841 | 791 | 859 | 856 | 849 | 878 | 970 | 900 |
| 2019 | 785 | 836 | 816 | 826 | 940 | 895 | 868 | 809 | 898 | 973 | 913 | 910 |
| 2020 | 847 | 846 | 811 | 957 | 912 | 868 | 679 | 923 | 870 | 911 | 937 | 937 |
| 2021 | 954 | 875 | 824 | 849 | 959 | 946 | 889 | 905 | 991 | 1,009 | 979 | 1,030 |
| 2022 | 957 | 1,006 | 1,067 | 902 | 854 | 944 | 853 | 912 | 965 | 914 | 977 | 1,038 |
| 2023 | 1,154 | 1,090 | 1,108 | 973 | 1,102 | 973 | 1,110 | 1,010 | 1,129 | 1,132 | 1,094 | 1,093 |
| 2024 | 1,108 | 1,025 | 1,193 | 925 | ||||||||
| - = No Data Reported; -- = Not Applicable; NA = Not Available; W = Withheld to avoid disclosure of individual company data. |
| Release Date: 6/28/2024 |
| Next Release Date: 7/31/2024 |