|
Download Data (XLS File) |
|
||||||||
|
||||||||
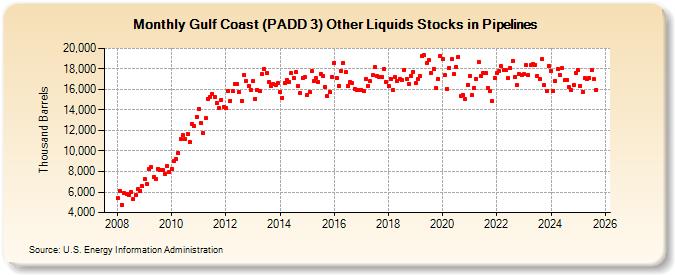
| Gulf Coast (PADD 3) Other Liquids Stocks in Pipelines (Thousand Barrels) | ||||||||
| Year | Jan | Feb | Mar | Apr | May | Jun | Jul | Aug | Sep | Oct | Nov | Dec |
|---|---|---|---|---|---|---|---|---|---|---|---|---|
| 2008 | 5,374 | 6,120 | 4,771 | 5,875 | 5,821 | 5,727 | 5,992 | 5,297 | 5,711 | 6,253 | 6,132 | 6,587 |
| 2009 | 7,235 | 6,827 | 8,250 | 8,431 | 7,442 | 7,297 | 8,293 | 8,117 | 8,119 | 7,805 | 8,581 | 7,971 |
| 2010 | 8,245 | 9,051 | 9,183 | 9,827 | 11,134 | 11,516 | 11,179 | 11,692 | 10,880 | 12,648 | 12,429 | 13,341 |
| 2011 | 14,101 | 12,701 | 11,724 | 13,189 | 15,082 | 15,299 | 15,566 | 15,253 | 14,670 | 14,196 | 15,018 | 14,331 |
| 2012 | 14,215 | 15,856 | 14,907 | 15,834 | 16,540 | 16,551 | 15,731 | 14,908 | 17,437 | 16,804 | 16,321 | 15,913 |
| 2013 | 16,819 | 15,076 | 15,967 | 15,842 | 17,522 | 18,029 | 17,563 | 16,746 | 16,347 | 16,534 | 16,449 | 16,674 |
| 2014 | 15,739 | 15,183 | 16,610 | 16,964 | 16,740 | 17,577 | 17,150 | 17,692 | 16,357 | 15,685 | 17,140 | 17,203 |
| 2015 | 15,450 | 15,716 | 17,762 | 16,798 | 17,097 | 16,742 | 17,538 | 17,323 | 16,285 | 15,338 | 15,726 | 17,243 |
| 2016 | 18,607 | 17,157 | 16,315 | 17,837 | 18,603 | 17,701 | 16,324 | 16,700 | 16,583 | 16,089 | 15,953 | 15,922 |
| 2017 | 15,985 | 15,804 | 17,028 | 16,377 | 16,795 | 17,368 | 18,141 | 17,296 | 17,241 | 17,221 | 18,012 | 16,773 |
| 2018 | 16,379 | 17,044 | 15,913 | 17,165 | 16,868 | 17,063 | 16,873 | 17,925 | 17,009 | 16,567 | 17,346 | 17,730 |
| 2019 | 16,618 | 17,023 | 17,342 | 19,219 | 19,314 | 18,577 | 18,821 | 17,648 | 18,008 | 16,116 | 17,019 | 19,271 |
| 2020 | 18,949 | 17,374 | 16,082 | 18,136 | 18,956 | 17,506 | 18,229 | 19,202 | 15,341 | 15,463 | 15,022 | 16,465 |
| 2021 | 17,345 | 15,432 | 16,168 | 17,043 | 18,677 | 17,291 | 17,646 | 17,575 | 16,132 | 15,803 | 14,871 | 17,137 |
| 2022 | 17,588 | 17,782 | 18,255 | 17,849 | 17,868 | 17,079 | 18,095 | 18,773 | 17,210 | 16,395 | 17,528 | 17,436 |
| 2023 | 17,842 | 18,780 | 17,847 | 18,854 | 18,974 | 18,857 | 17,563 | 17,175 | 19,002 | 16,496 | 16,252 | 18,750 |
| 2024 | 17,869 | |||||||||||
| - = No Data Reported; -- = Not Applicable; NA = Not Available; W = Withheld to avoid disclosure of individual company data. |
| Release Date: 3/29/2024 |
| Next Release Date: 4/30/2024 |