|
Download Data (XLS File) |
|
||||||||
|
||||||||
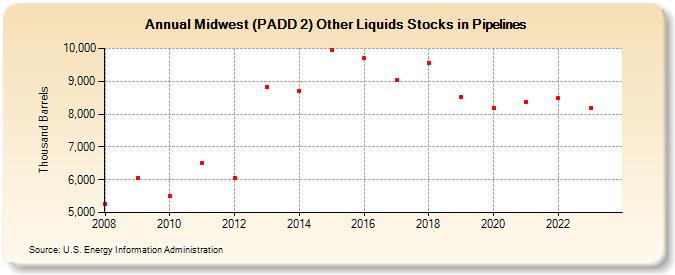
| Midwest (PADD 2) Other Liquids Stocks in Pipelines (Thousand Barrels) | ||||||||
| Decade | Year-0 | Year-1 | Year-2 | Year-3 | Year-4 | Year-5 | Year-6 | Year-7 | Year-8 | Year-9 |
|---|---|---|---|---|---|---|---|---|---|---|
| 2000's | 5,270 | 6,054 | ||||||||
| 2010's | 5,514 | 6,511 | 6,064 | 8,818 | 8,710 | 9,966 | 9,698 | 9,024 | 9,558 | 8,515 |
| 2020's | 8,188 | 8,377 | 8,478 | 8,174 |
| - = No Data Reported; -- = Not Applicable; NA = Not Available; W = Withheld to avoid disclosure of individual company data. |
| Release Date: 3/29/2024 |
| Next Release Date: 8/30/2024 |