|
Download Data (XLS File) |
|
||||||||
|
||||||||
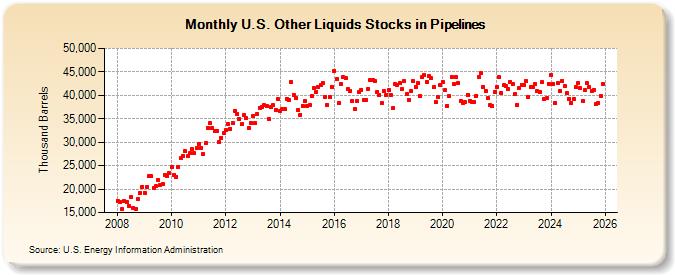
| U.S. Other Liquids Stocks in Pipelines (Thousand Barrels) | ||||||||
| Year | Jan | Feb | Mar | Apr | May | Jun | Jul | Aug | Sep | Oct | Nov | Dec |
|---|---|---|---|---|---|---|---|---|---|---|---|---|
| 2008 | 17,542 | 17,290 | 15,671 | 17,513 | 17,210 | 16,481 | 18,281 | 15,984 | 15,763 | 17,891 | 19,125 | 20,451 |
| 2009 | 19,247 | 20,507 | 22,777 | 22,726 | 20,270 | 20,583 | 22,001 | 20,964 | 21,045 | 23,041 | 22,702 | 23,442 |
| 2010 | 24,743 | 23,047 | 22,668 | 24,691 | 26,539 | 27,070 | 28,115 | 27,024 | 27,611 | 28,489 | 27,676 | 28,713 |
| 2011 | 29,684 | 28,797 | 27,399 | 29,823 | 33,027 | 34,019 | 32,971 | 32,420 | 32,419 | 30,042 | 31,001 | 31,922 |
| 2012 | 32,568 | 33,972 | 32,907 | 34,121 | 36,655 | 35,975 | 34,964 | 33,832 | 35,749 | 35,134 | 33,063 | 34,050 |
| 2013 | 35,644 | 33,989 | 36,015 | 37,376 | 37,457 | 37,835 | 37,642 | 34,976 | 37,603 | 37,871 | 36,919 | 39,115 |
| 2014 | 36,729 | 36,995 | 36,978 | 39,264 | 39,020 | 42,796 | 40,077 | 39,487 | 36,859 | 35,865 | 37,755 | 38,691 |
| 2015 | 37,669 | 37,983 | 39,768 | 41,501 | 40,679 | 41,691 | 42,277 | 42,631 | 39,616 | 37,973 | 39,715 | 41,767 |
| 2016 | 45,281 | 43,429 | 38,382 | 42,467 | 43,827 | 43,612 | 41,238 | 40,953 | 38,731 | 37,097 | 38,863 | 40,752 |
| 2017 | 41,186 | 39,098 | 39,012 | 41,354 | 43,307 | 43,195 | 43,069 | 40,745 | 40,032 | 38,344 | 40,856 | 40,164 |
| 2018 | 41,085 | 40,135 | 37,210 | 42,501 | 42,259 | 42,586 | 41,313 | 42,995 | 40,270 | 39,018 | 40,934 | 42,964 |
| 2019 | 41,778 | 42,547 | 39,833 | 43,814 | 44,318 | 42,936 | 44,184 | 43,592 | 41,673 | 38,489 | 39,544 | 42,137 |
| 2020 | 42,856 | 41,049 | 37,730 | 39,806 | 43,968 | 42,354 | 43,907 | 42,589 | 38,694 | 38,307 | 38,472 | 40,151 |
| 2021 | 38,881 | 38,603 | 38,533 | 39,860 | 43,963 | 44,732 | 41,862 | 40,957 | 39,412 | 37,833 | 37,813 | 40,673 |
| 2022 | 41,855 | 43,805 | 40,395 | 42,125 | 41,910 | 41,332 | 42,879 | 42,407 | 40,203 | 37,996 | 41,632 | 42,260 |
| 2023 | 42,202 | 43,136 | 39,777 | 41,979 | 42,244 | 43,199 | 41,408 | 41,202 | 43,153 | 39,004 | 39,670 | 42,620 |
| 2024 | 44,131 | |||||||||||
| - = No Data Reported; -- = Not Applicable; NA = Not Available; W = Withheld to avoid disclosure of individual company data. |
| Release Date: 3/29/2024 |
| Next Release Date: 4/30/2024 |