|
Download Data (XLS File) |
|
||||||||
|
||||||||
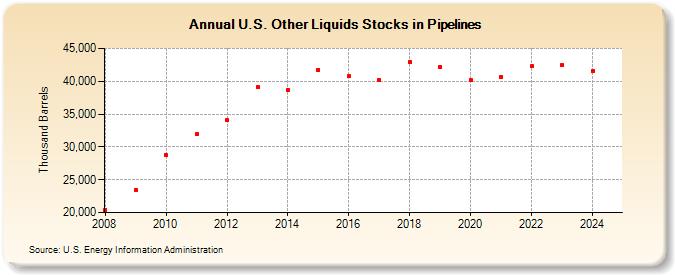
| U.S. Other Liquids Stocks in Pipelines (Thousand Barrels) | ||||||||
| Decade | Year-0 | Year-1 | Year-2 | Year-3 | Year-4 | Year-5 | Year-6 | Year-7 | Year-8 | Year-9 |
|---|---|---|---|---|---|---|---|---|---|---|
| 2000's | 20,451 | 23,442 | ||||||||
| 2010's | 28,713 | 31,922 | 34,050 | 39,115 | 38,691 | 41,767 | 40,752 | 40,164 | 42,964 | 42,137 |
| 2020's | 40,151 | 40,673 | 42,260 | 42,477 | 41,588 |
| - = No Data Reported; -- = Not Applicable; NA = Not Available; W = Withheld to avoid disclosure of individual company data. |
| Release Date: 6/30/2025 |
| Next Release Date: 8/29/2025 |