|
Download Data (XLS File) |
|
||||||||
|
||||||||
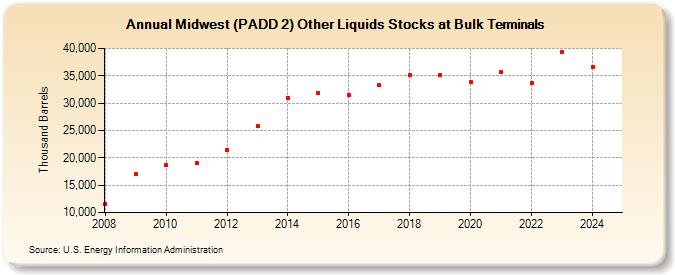
| Midwest (PADD 2) Other Liquids Stocks at Bulk Terminals (Thousand Barrels) | ||||||||
| Decade | Year-0 | Year-1 | Year-2 | Year-3 | Year-4 | Year-5 | Year-6 | Year-7 | Year-8 | Year-9 |
|---|---|---|---|---|---|---|---|---|---|---|
| 2000's | 11,565 | 16,999 | ||||||||
| 2010's | 18,687 | 19,106 | 21,504 | 25,847 | 30,938 | 31,812 | 31,558 | 33,261 | 35,174 | 35,107 |
| 2020's | 33,798 | 35,595 | 33,645 | 39,327 |
| - = No Data Reported; -- = Not Applicable; NA = Not Available; W = Withheld to avoid disclosure of individual company data. |
| Release Date: 3/29/2024 |
| Next Release Date: 8/30/2024 |