|
Download Data (XLS File) |
|
||||||||
|
||||||||
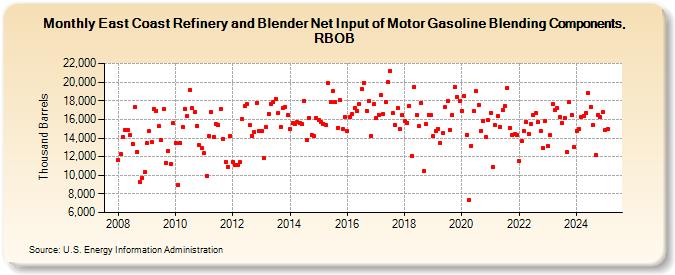
| East Coast Refinery and Blender Net Input of Motor Gasoline Blending Components, RBOB (Thousand Barrels) | ||||||||
| Year | Jan | Feb | Mar | Apr | May | Jun | Jul | Aug | Sep | Oct | Nov | Dec |
|---|---|---|---|---|---|---|---|---|---|---|---|---|
| 2008 | 11,605 | 12,249 | 14,157 | 14,846 | 14,866 | 14,302 | 13,396 | 17,281 | 12,522 | 9,324 | 9,756 | 10,373 |
| 2009 | 13,416 | 14,702 | 13,546 | 17,127 | 16,953 | 15,244 | 13,759 | 17,070 | 11,351 | 12,637 | 11,188 | 15,570 |
| 2010 | 13,504 | 9,010 | 13,450 | 15,177 | 17,155 | 16,338 | 19,201 | 17,212 | 16,784 | 15,327 | 13,215 | 12,903 |
| 2011 | 12,348 | 9,968 | 14,197 | 16,750 | 14,137 | 15,508 | 15,392 | 17,117 | 13,945 | 11,474 | 10,924 | 14,268 |
| 2012 | 11,421 | 11,091 | 11,151 | 11,374 | 16,030 | 17,451 | 17,641 | 15,359 | 14,259 | 14,600 | 17,782 | 14,700 |
| 2013 | 14,706 | 11,885 | 15,135 | 16,627 | 17,684 | 17,833 | 18,213 | 16,702 | 15,235 | 17,275 | 17,309 | 16,427 |
| 2014 | 14,967 | 15,599 | 15,456 | 15,696 | 15,584 | 15,495 | 18,026 | 13,800 | 16,200 | 14,329 | 14,167 | 16,172 |
| 2015 | 15,959 | 15,689 | 15,545 | 15,436 | 19,898 | 17,865 | 19,029 | 17,813 | 15,108 | 18,085 | 14,945 | 16,260 |
| 2016 | 14,724 | 16,247 | 16,547 | 17,240 | 16,887 | 17,623 | 19,245 | 19,956 | 16,951 | 18,014 | 14,196 | 17,619 |
| 2017 | 16,103 | 16,510 | 18,581 | 16,628 | 17,869 | 19,965 | 21,202 | 16,647 | 15,388 | 17,230 | 14,917 | 16,474 |
| 2018 | 15,819 | 15,644 | 17,486 | 12,116 | 19,484 | 16,511 | 15,260 | 17,786 | 10,440 | 15,459 | 16,511 | 16,431 |
| 2019 | 14,207 | 14,726 | 15,012 | 13,489 | 14,493 | 17,290 | 17,925 | 14,893 | 16,472 | 19,451 | 18,442 | 18,009 |
| 2020 | 16,953 | 18,492 | 14,369 | 7,365 | 13,171 | 16,851 | 19,005 | 17,579 | 14,803 | 15,782 | 14,122 | 15,901 |
| 2021 | 16,724 | 10,908 | 15,353 | 16,367 | 15,200 | 17,033 | 17,384 | 19,412 | 15,112 | 14,289 | 14,404 | 14,299 |
| 2022 | 11,516 | 13,641 | 14,728 | 15,738 | 14,459 | 15,505 | 16,508 | 16,690 | 15,685 | 14,783 | 12,888 | 15,844 |
| 2023 | 13,143 | 14,452 | 16,900 | 17,178 | 17,383 | 16,252 | 15,619 | 16,166 | 12,515 | 17,859 | 16,497 | 13,087 |
| 2024 | 14,736 | |||||||||||
| - = No Data Reported; -- = Not Applicable; NA = Not Available; W = Withheld to avoid disclosure of individual company data. |
| Release Date: 3/29/2024 |
| Next Release Date: 4/30/2024 |