|
Download Data (XLS File) |
|
||||||||
|
||||||||
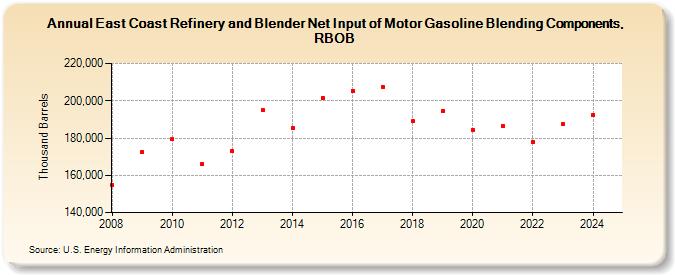
| East Coast Refinery and Blender Net Input of Motor Gasoline Blending Components, RBOB (Thousand Barrels) | ||||||||
| Decade | Year-0 | Year-1 | Year-2 | Year-3 | Year-4 | Year-5 | Year-6 | Year-7 | Year-8 | Year-9 |
|---|---|---|---|---|---|---|---|---|---|---|
| 2000's | 154,677 | 172,563 | ||||||||
| 2010's | 179,276 | 166,028 | 172,859 | 195,031 | 185,491 | 201,632 | 205,249 | 207,514 | 188,947 | 194,409 |
| 2020's | 184,393 | 186,485 | 177,985 | 187,051 |
| - = No Data Reported; -- = Not Applicable; NA = Not Available; W = Withheld to avoid disclosure of individual company data. |
| Release Date: 6/28/2024 |
| Next Release Date: 8/30/2024 |