|
Download Data (XLS File) |
|
||||||||
|
||||||||
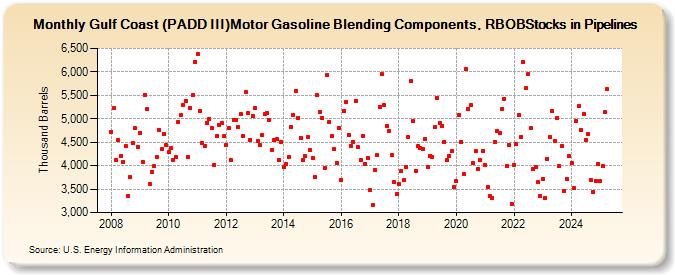
| Gulf Coast (PADD III)Motor Gasoline Blending Components, RBOBStocks in Pipelines (Thousand Barrels) | ||||||||
| Year | Jan | Feb | Mar | Apr | May | Jun | Jul | Aug | Sep | Oct | Nov | Dec |
|---|---|---|---|---|---|---|---|---|---|---|---|---|
| 2008 | 4,720 | 5,222 | 4,125 | 4,547 | 4,201 | 4,088 | 4,409 | 3,351 | 3,757 | 4,475 | 4,793 | 4,399 |
| 2009 | 4,706 | 4,087 | 5,514 | 5,211 | 3,611 | 3,870 | 3,985 | 4,177 | 4,770 | 4,346 | 4,667 | 4,438 |
| 2010 | 4,282 | 4,380 | 4,122 | 4,182 | 4,935 | 5,076 | 5,287 | 5,381 | 4,194 | 5,232 | 5,509 | 6,218 |
| 2011 | 6,381 | 5,159 | 4,478 | 4,429 | 4,919 | 5,002 | 4,801 | 4,009 | 4,635 | 4,877 | 4,904 | 4,623 |
| 2012 | 4,439 | 4,798 | 4,115 | 4,983 | 4,980 | 4,819 | 5,099 | 4,629 | 5,580 | 5,122 | 4,542 | 5,051 |
| 2013 | 5,225 | 4,532 | 4,435 | 4,644 | 5,100 | 5,116 | 4,974 | 4,341 | 4,542 | 4,562 | 4,113 | 4,501 |
| 2014 | 3,962 | 4,028 | 4,188 | 4,829 | 5,084 | 5,593 | 5,018 | 4,598 | 4,123 | 4,204 | 4,614 | 4,331 |
| 2015 | 4,170 | 3,766 | 5,499 | 5,154 | 5,015 | 3,950 | 5,936 | 4,929 | 4,622 | 4,345 | 4,066 | 4,809 |
| 2016 | 3,698 | 5,164 | 5,361 | 4,659 | 4,424 | 4,513 | 5,388 | 4,396 | 4,125 | 4,638 | 4,043 | 4,167 |
| 2017 | 3,474 | 3,155 | 3,913 | 4,227 | 5,253 | 5,948 | 5,288 | 4,846 | 4,746 | 4,219 | 3,645 | 3,388 |
| 2018 | 3,611 | 3,888 | 3,687 | 3,977 | 4,604 | 5,796 | 4,942 | 3,894 | 4,414 | 4,368 | 4,349 | 4,564 |
| 2019 | 3,965 | 4,216 | 4,193 | 4,829 | 5,441 | 4,900 | 4,846 | 4,506 | 4,112 | 4,201 | 4,315 | 3,539 |
| 2020 | 3,670 | 5,082 | 4,505 | 3,825 | 6,058 | 5,214 | 5,286 | 4,049 | 4,303 | 3,937 | 4,118 | 4,308 |
| 2021 | 4,009 | 3,553 | 3,354 | 3,315 | 4,509 | 4,730 | 4,691 | 5,208 | 5,426 | 3,990 | 4,441 | 3,193 |
| 2022 | 4,016 | 4,454 | 5,080 | 4,619 | 6,219 | 5,662 | 5,955 | 4,795 | 3,924 | 3,964 | 3,647 | 3,352 |
| 2023 | 3,895 | 3,513 | 4,446 | 4,833 | 5,472 | 4,732 | 5,217 | 3,978 | 4,394 | 3,346 | 4,005 | 4,486 |
| 2024 | 4,056 | |||||||||||
| - = No Data Reported; -- = Not Applicable; NA = Not Available; W = Withheld to avoid disclosure of individual company data. |
| Release Date: 3/29/2024 |
| Next Release Date: 4/30/2024 |