|
Download Data (XLS File) |
|
||||||||
|
||||||||
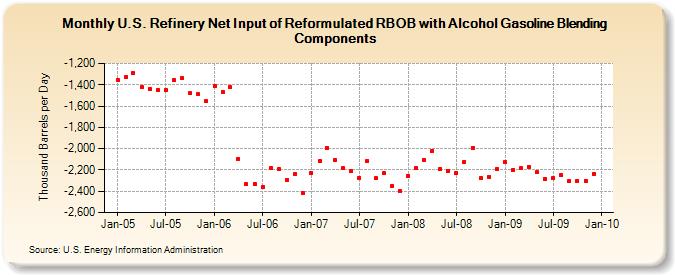
| U.S. Refinery Net Input of Reformulated RBOB with Alcohol Gasoline Blending Components (Thousand Barrels per Day) | ||||||||
| Year | Jan | Feb | Mar | Apr | May | Jun | Jul | Aug | Sep | Oct | Nov | Dec |
|---|---|---|---|---|---|---|---|---|---|---|---|---|
| 2005 | -1,356 | -1,328 | -1,293 | -1,419 | -1,441 | -1,447 | -1,448 | -1,356 | -1,337 | -1,480 | -1,490 | -1,556 |
| 2006 | -1,412 | -1,469 | -1,421 | -2,096 | -2,333 | -2,330 | -2,358 | -2,184 | -2,193 | -2,291 | -2,237 | -2,419 |
| 2007 | -2,224 | -2,117 | -1,990 | -2,105 | -2,186 | -2,212 | -2,273 | -2,114 | -2,276 | -2,233 | -2,351 | -2,397 |
| 2008 | -2,252 | -2,184 | -2,105 | -2,019 | -2,187 | -2,207 | -2,231 | -2,124 | -1,993 | -2,277 | -2,264 | -2,189 |
| 2009 | -2,123 | -2,200 | -2,186 | -2,169 | -2,222 | -2,281 | -2,276 | -2,248 | -2,308 | -2,304 | -2,302 | -2,234 |
| - = No Data Reported; -- = Not Applicable; NA = Not Available; W = Withheld to avoid disclosure of individual company data. |
| Release Date: 3/29/2024 |
| Next Release Date: 4/30/2024 |