|
Download Data (XLS File) |
|
||||||||
|
||||||||
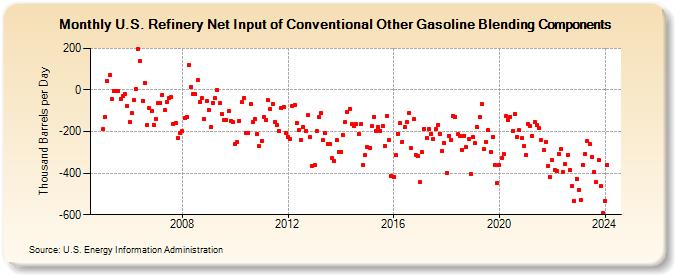
| U.S. Refinery Net Input of Conventional Other Gasoline Blending Components (Thousand Barrels per Day) | ||||||||
| Year | Jan | Feb | Mar | Apr | May | Jun | Jul | Aug | Sep | Oct | Nov | Dec |
|---|---|---|---|---|---|---|---|---|---|---|---|---|
| 2005 | -189 | -132 | 44 | 74 | -45 | -3 | -3 | -5 | -42 | -30 | -20 | -77 |
| 2006 | -155 | -112 | -50 | 5 | 197 | 140 | -52 | 33 | -168 | -88 | -102 | -167 |
| 2007 | -142 | -65 | -61 | -23 | -94 | -59 | -40 | -36 | -162 | -158 | -230 | -207 |
| 2008 | -199 | -135 | -128 | 120 | 16 | -18 | -21 | 46 | -56 | -41 | -139 | -54 |
| 2009 | -95 | -180 | -63 | -39 | -1 | -64 | -114 | -145 | -144 | -103 | -151 | -156 |
| 2010 | -261 | -251 | -147 | -58 | -39 | -207 | -205 | -69 | -153 | -141 | -213 | -271 |
| 2011 | -244 | -128 | -144 | -49 | -93 | -66 | -153 | -168 | -197 | -89 | -80 | -208 |
| 2012 | -224 | -238 | -79 | -73 | -160 | -192 | -239 | -178 | -196 | -122 | -225 | -365 |
| 2013 | -362 | -199 | -131 | -111 | -242 | -207 | -259 | -258 | -328 | -340 | -243 | -296 |
| 2014 | -297 | -217 | -156 | -106 | -92 | -165 | -175 | -165 | -212 | -166 | -362 | -314 |
| 2015 | -274 | -277 | -175 | -128 | -197 | -178 | -198 | -171 | -268 | -124 | -239 | -413 |
| 2016 | -418 | -314 | -210 | -159 | -250 | -179 | -156 | -109 | -281 | -141 | -312 | -316 |
| 2017 | -445 | -300 | -186 | -229 | -189 | -214 | -235 | -190 | -167 | -210 | -293 | -256 |
| 2018 | -401 | -220 | -239 | -123 | -130 | -214 | -219 | -287 | -219 | -275 | -236 | -403 |
| 2019 | -228 | -257 | -179 | -131 | -66 | -285 | -248 | -194 | -299 | -226 | -363 | -448 |
| 2020 | -362 | -328 | -308 | -126 | -146 | -128 | -197 | -116 | -224 | -193 | -233 | -269 |
| 2021 | -312 | -162 | -175 | -219 | -155 | -168 | -185 | -241 | -290 | -250 | -364 | -419 |
| 2022 | -339 | -385 | -391 | -306 | -286 | -394 | -358 | -311 | -386 | -461 | -534 | -427 |
| 2023 | -480 | -528 | -360 | -307 | -246 | -258 | -324 | -394 | -444 | -338 | -463 | -590 |
| 2024 | -533 | |||||||||||
| - = No Data Reported; -- = Not Applicable; NA = Not Available; W = Withheld to avoid disclosure of individual company data. |
| Release Date: 3/29/2024 |
| Next Release Date: 4/30/2024 |