|
Download Data (XLS File) |
|
||||||||
|
||||||||
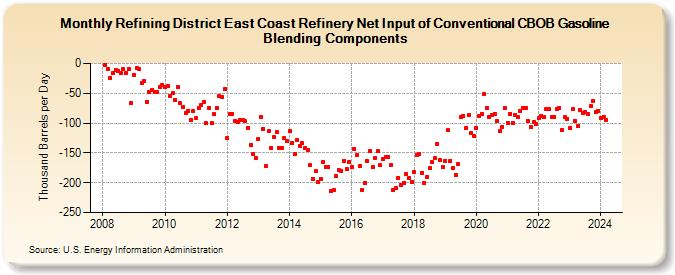
| Refining District East Coast Refinery Net Input of Conventional CBOB Gasoline Blending Components (Thousand Barrels per Day) | ||||||||
| Year | Jan | Feb | Mar | Apr | May | Jun | Jul | Aug | Sep | Oct | Nov | Dec |
|---|---|---|---|---|---|---|---|---|---|---|---|---|
| 2008 | -2 | -10 | -24 | -16 | -11 | -13 | -16 | -10 | -16 | -9 | -67 | |
| 2009 | -19 | -8 | -9 | -33 | -29 | -65 | -48 | -44 | -47 | -47 | -40 | -36 |
| 2010 | -40 | -38 | -54 | -50 | -61 | -39 | -67 | -73 | -83 | -79 | -94 | -80 |
| 2011 | -91 | -75 | -70 | -65 | -100 | -74 | -100 | -85 | -75 | -55 | -56 | -43 |
| 2012 | -125 | -84 | -84 | -96 | -98 | -94 | -95 | -97 | -108 | -136 | -152 | -159 |
| 2013 | -126 | -89 | -110 | -172 | -113 | -141 | -124 | -115 | -142 | -141 | -125 | -130 |
| 2014 | -114 | -134 | -152 | -129 | -138 | -134 | -142 | -145 | -171 | -193 | -181 | -198 |
| 2015 | -193 | -165 | -173 | -174 | -214 | -213 | -189 | -179 | -180 | -163 | -177 | -165 |
| 2016 | -174 | -143 | -153 | -172 | -212 | -201 | -164 | -147 | -174 | -158 | -147 | -170 |
| 2017 | -160 | -157 | -157 | -171 | -212 | -208 | -192 | -203 | -200 | -186 | -192 | -199 |
| 2018 | -182 | -154 | -151 | -183 | -201 | -190 | -175 | -166 | -159 | -135 | -162 | -173 |
| 2019 | -163 | -112 | -163 | -176 | -187 | -169 | -90 | -88 | -109 | -86 | -117 | -122 |
| 2020 | -108 | -88 | -85 | -52 | -74 | -89 | -86 | -84 | -97 | -114 | -106 | -75 |
| 2021 | -99 | -84 | -99 | -86 | -90 | -80 | -74 | -74 | -97 | -106 | -98 | -102 |
| 2022 | -92 | -88 | -89 | -77 | -77 | -90 | -89 | -76 | -74 | -111 | -90 | -93 |
| 2023 | -108 | -77 | -96 | -105 | -78 | -83 | -81 | -84 | -72 | -63 | -81 | -80 |
| 2024 | -92 | -89 | ||||||||||
| - = No Data Reported; -- = Not Applicable; NA = Not Available; W = Withheld to avoid disclosure of individual company data. |
| Release Date: 4/30/2024 |
| Next Release Date: 5/31/2024 |